Figure 2.
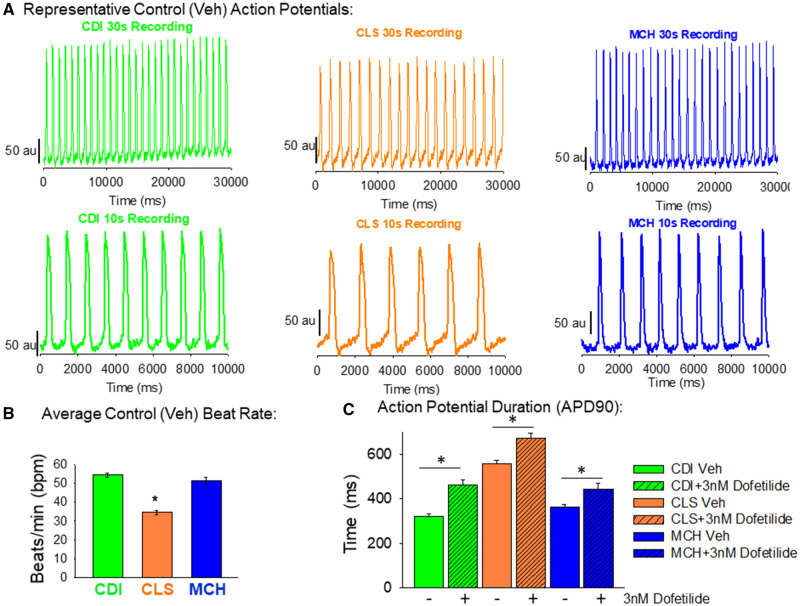
Baseline action potential characterization of each hiPSC-CM cell type. A, Representative original recordings of optical action potentials in each cell type. In this study, 30 s recordings were made for each compound tested. Shown in the top row of (A) are 30 s action potential recordings of each cell type. The bottom row of (A) shows a shorter time scale (10 s) of these original recordings. B, Quantification of the spontaneous beat rate shows similarity between CDI and MCH hiPSC-CMs (54.3 ± 5.2 bpm; n = 18 vs 51.3 ± 6.9 bpm; n = 18). The CLS hiPSC-CM functional mature syncytia, on the other hand, had significantly slower spontaneous beat rate (34.5 ± 4.8 bpm; n = 18) than the other groups. Data mean±standard deviation (SD); *significant difference, p < .001, 1-way ANOVA. C, Quantification of action potential duration 90 (APD90) also shows similarities between CDI and MCH functional mature syncytia (322.2 ± 36.3 ms; n = 18 and 363.2 ± 47.1 ms; n = 18). The CLS hiPSC-CM functional mature syncytia, however, had significantly longer APD90 than the other 2 cell types (554.4 ± 71.8 ms; n = 18); *significant difference, 1-Way ANOVA; p < .001. Also, 3 nM dofetilide was used as a positive control for APD90 prolongation for each cell type, and each cell type responded with longer APD90 values (CDI + 3 nM dofetilide = 461 ± 100.9 ms; n = 23/MCH + 3 nM dofetilide = 444.1 ± 121.7 ms; n = 23 and CLS + 3nM Dofetilide = 672.2 ± 103.3 ms; n = 23). *Significant difference from baseline values (vehicle control) in each cell type, t-test.

