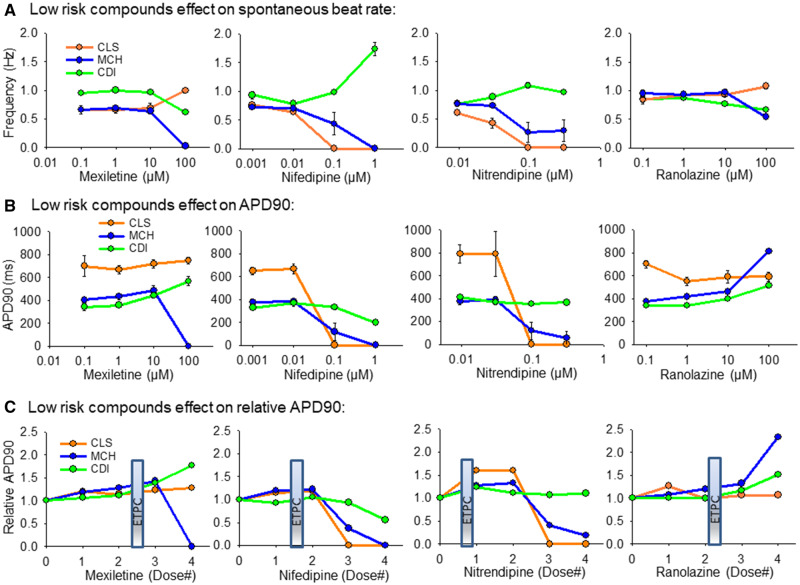
Figure 4.
Summary of hiPSC-CM cell type responses to low-risk compounds. A, Low-risk compounds effect on spontaneous beat rate, Hz. B, Low-risk compound effects on APD90 values. C, Low-risk compound effects on the APD90 relative to vehicle control values. The clinical effective therapeutic plasma concentration (ETPC) is positioned on each plot in (C) to provide context for the drug concentration relative to therapeutic levels. All data expressed as mean±SEM.

