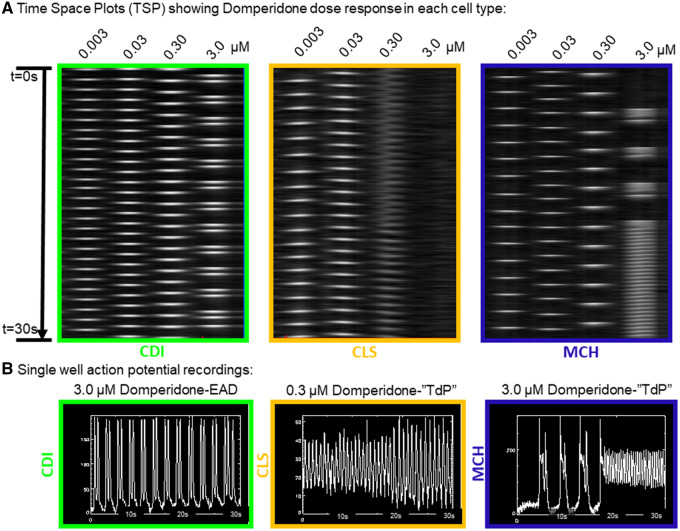
Figure 6.
Cell type specific responses to the antiemetic intermediate-risk compound domperidone. A, Time space plots of a single row of a 96-well plate showing action potential responses to exposure with domperidone over a log range of concentrations from 0.003 to 3.0 µM. The green box is for CDI hiPSC-CMs where EADs were observed at the highest concentration. The center orange box is for CLS hiPSC-CMs where reentrant, TdP activation patterns were observed at 0.30 µM. The blue box is for MCH hiPSC-CMs where APD prolongation was apparent at 0.30 µM and reentrant, TdP activation patterns were observed at the highest concentration (3.0 µM). B, Single well action potential recordings for each cell type treated with the indicated concentration of Domperidone.

