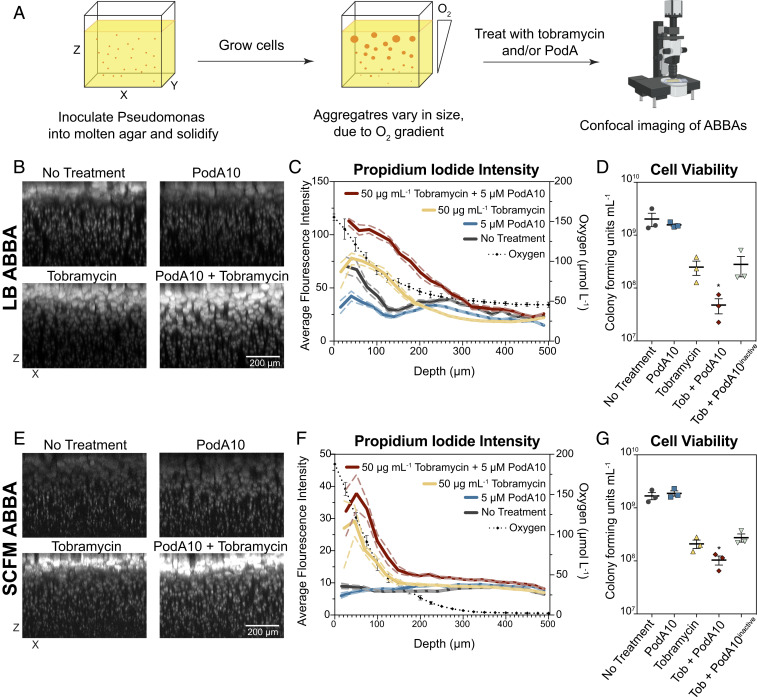
Fig. 4.
Microscopy imaging of propidium-iodide-stained ABBAs treated with PodA10 and tobramycin. (A) Cells were incubated in an ABBA as described in Materials and Methods, followed by treatment with PodA10 (5 µM), tobramycin (50 µg mL−1), or PodA10 and tobramycin with subsequent PI staining. For no treatment conditions, buffer was added in lieu of protein. Cells were grown in either (B) LB or (E) SCFM. (B and E) Maximum-intensity XZ projections where the brightness/contrast in each dataset were normalized to the tobramycin-only sample. (C and F) Average pixel intensity (left y axis) of PI calculated from images in B and E. The solid line represents the mean intensity of aggregates, and the dashed line represents the 95% confidence interval. Both mean and confidence interval were calculated as described in Materials and Methods with a bin size of 20. Each aggregate intensity can be seen in SI Appendix, Fig. S10. The dotted black line represents average oxygen concentration measured at time of treatment as plotted on the right y axis; parallel O2 measurement time points are found in SI Appendix, Fig. S9. Data points (diamonds) are the mean of technical triplicates of biological triplicates, and error bars represent SD. (D and G) PodA and tobramycin ABBA treatments in Eppendorf tubes were homogenized and diluted in series, and dilutions were plated onto LB agar. Cells were counted if a dilution contained 10 to 100 colonies. (D) Aggregates were grown in LB (D) and in SCFM (G). Data represent the mean of technical triplicates from three biological replicates that were treated on different days, with error bars representing the SEM. For D and E, an unpaired t test was used to calculate P values between tobramycin and tobramycin + PodA10 treatments. *P < 0.05.

