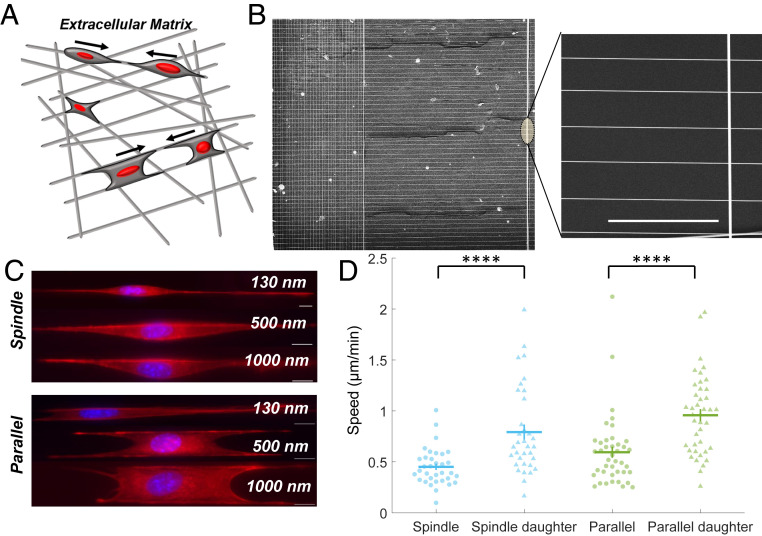
Fig. 1.
Cell motility on nanofiber network. (A) Depiction of a cell’s in vivo ECM environment with ECM fibers. (B) SEM image of aligned parallel fibers (500 nm) manufactured using the STEP method and used for CIL experiments. (Scale bar, 50 μm.) (C) Spindle and parallel-cuboidal cell morphologies on fibers of three diameters stained for actin (red) and nucleus (blue). Cells on 130 and 150 nm diameter fibers form long protrusions (SI Appendix, Fig. S1), shown here only for 130 nm. (D) Daughter cells have significantly increased speed compared to cells that have not recently divided (n = 34 and 41 for each spindle and parallel case on 500 nm fibers, respectively). Error bars show SE.

