Fig. 7.
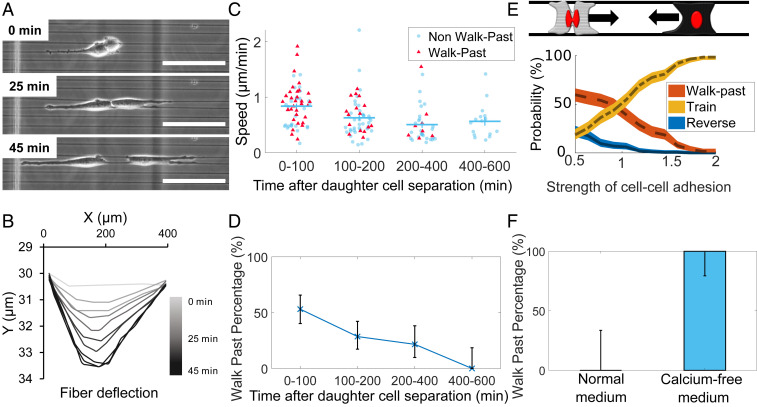
Effects of cell division and cell–cell adhesion. (A) Cells create fiber deformations postdivision. (Scale bar, 50 μm.) (B) Measurement of fiber deflection over time shows these tractions quickly stabilize; time shown is time after cell division. Other examples are shown in SI Appendix, Fig. S5. (C) Cell speed and (D) walk past both decrease with time after division. (E) Our model suggests that decreasing cell–cell adhesion promotes walk past (see also SI Appendix, Fig. S8A). (F) Cells in low-calcium media show walk past in parallel geometry robustly even in the absence of division. Error bars in D and F indicate 95% confidence intervals, determined via the Clopper–Pearson method. n = 9 (normal), n = 16 (calcium-free).

