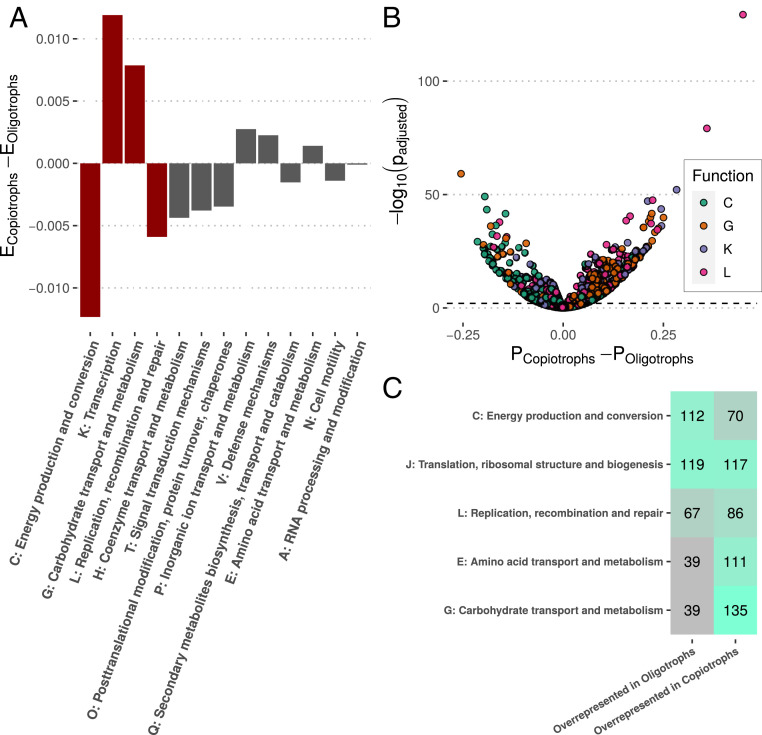
Fig. 4.
Copiotroph and oligotroph genomes are enriched for different functions. (A) The difference between the average proportion of genes in copiotroph genomes () and the average proportion of genes in oligotroph genomes () assigned to various classes of genes [COG classifications from eggnogmapper (107)]. Positive numbers indicate a functional class is enriched as a percentage of total genes in copiotrophs relative to oligotrophs, and negative values are the opposite. Only significantly differentially enriched classes are shown (with red bars emphasizing classes with larger differences). (B) Volcano plot showing differential prevalence across copiotroph () and oligotroph () genomes of specific gene families belonging to the most differentially enriched gene classes. (C) Table of differentially prevalent gene families from the most commonly differentially prevalent classes (SI Appendix, Fig. S24 has a full table).

