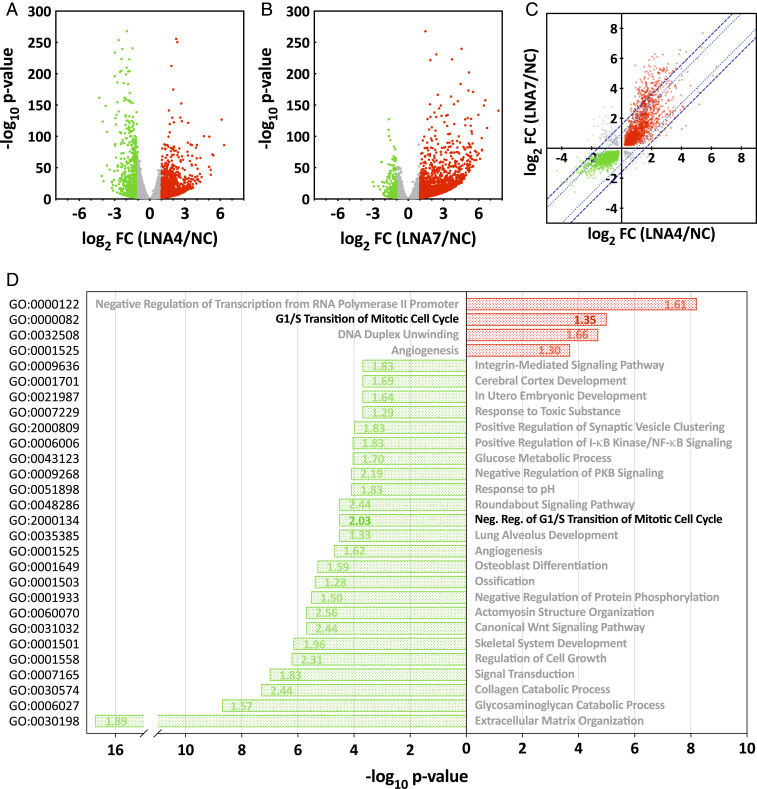
Fig. 5.
AhR modulates the HCMV infected-cell transcriptome. (A and B) Volcano plots showing the effect of AhR KD with two different AhR-specific LNAs. Fibroblasts were transfected with an AhR-specific LNA (A, LNA4 or B, LNA7) or a nonspecific control LNA (NC), and maintained in serum-free medium for 48 h, after which cultures were infected with HCMV at a multiplicity of 3 IU/cell. At 6 hpi, poly(A)+ RNA was prepared from infected cells and subjected to RNA-seq analysis (n = 2). Fold-change ratios (AhR-LNA/NC-LNA) and P values were determined. RNAs with a significant (P < 0.01) change of ≥ 2-fold in their expression levels are depicted by red (elevated) and green (lowered) dots; RNAs that did not meet these criteria are gray. (C) Fold change of cell-coded transcripts with significantly altered expression levels (q < 0.01) were plotted for LNA4- versus LNA7-treated cultures. RNAs with a significant (q < 0.01) change in their expression levels are depicted by red (elevated in response to both LNAs), green (lowered in response to both LNAs) and gray dots (LNAs generated opposing changes). The dotted (light blue) and dashed (dark blue) lines show the thresholds for two- and threefold variance between the AhR-KD LNA treatments, respectively. (D) Bar graph showing enriched biological process gene ontology terms of differentially expressed genes following treatment with AhR-specific LNAs. Green bars show GOs enriched within the group of transcripts negatively affected by AhR knockdown and red bars show GOs enriched within the group of transcripts up-regulated in AhR knockdown cells. The numbers within bars report the AhR target gene fold-enrichment values. Data are derived from the RNA-seq results presented in A–C.

