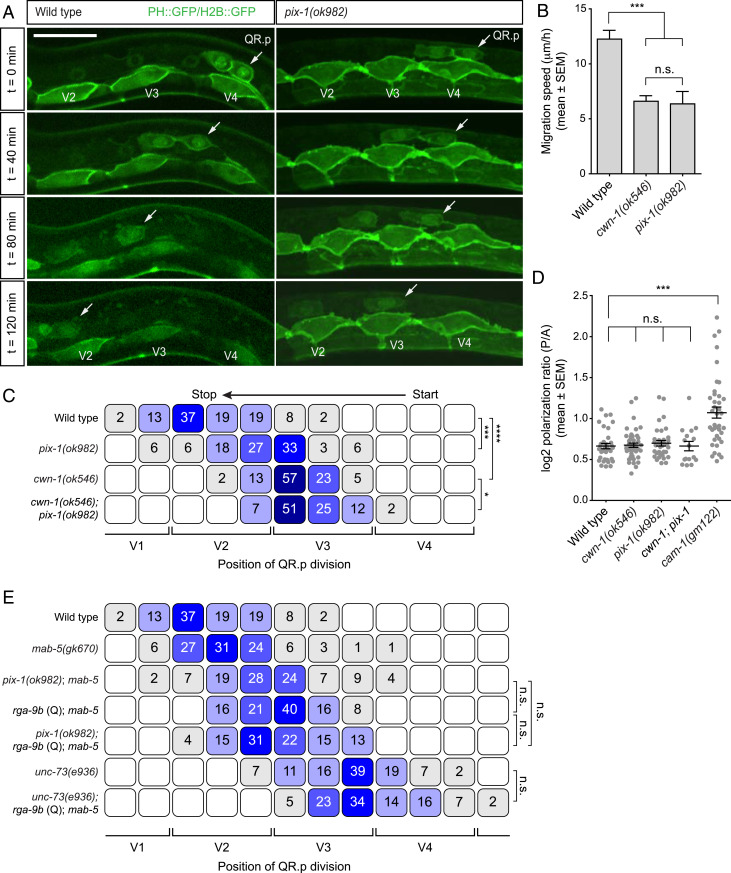
Fig. 6.
The Rho activating protein PIX-1 is part of the CWN-1/Wnt–MOM-5/Frizzled pathway. (A) Time-lapse imaging of QR.p migration in wild type and pix-1(ok982) animals. The seam (V) cells and QR.a and QR.p are marked with nuclear (H2B) and membrane-localized (PH) GFP (huIs63) (38). Anterior is left and dorsal is up (scale bar, 15 μm). (B) The average speed of QR.p during the first hour of migration. The bars represent mean ± SEM (n > 50 for all genotypes). The statistical significance was calculated using an unpaired t test (n.s., P ≥ 0.05, ***P < 0.001). cwn-1(ok546) data are from ref. 12. (C) The position of QR.p division with respect to seam cells, indicated as percentiles of the total number of cells analyzed (n > 50 except pix-1, n = 33). The statistical significance was calculated using Fisher’s exact test (*P < 0.05, ***P < 0.001, and ****P < 0.0001). cwn-1(ok546) data are from ref. 12. (D) Quantification of QR.p polarity as calculated by the ratio of the distance from the nucleus to the posterior and the anterior side of the cell. The black lines indicate mean ± SEM (n > 25 except cwn-1; pix-1, n = 16). The statistical significance was calculated using an unpaired t test (n.s., P ≥ 0.05, ***P < 0.001). cwn-1(ok546) data are from ref. 12. (E) The position of QR.p division with respect to the seam cells, indicated as percentiles of the total number of cells analyzed (n > 50 except unc-73(e936); rga-9b(Q); mab-5(gk670), n = 44). The pix-1 and rga-9b (Q)–containing strains have mab-5(gk670). The statistical significance was calculated using Fisher’s exact test (n.s., P ≥ 0.05).

