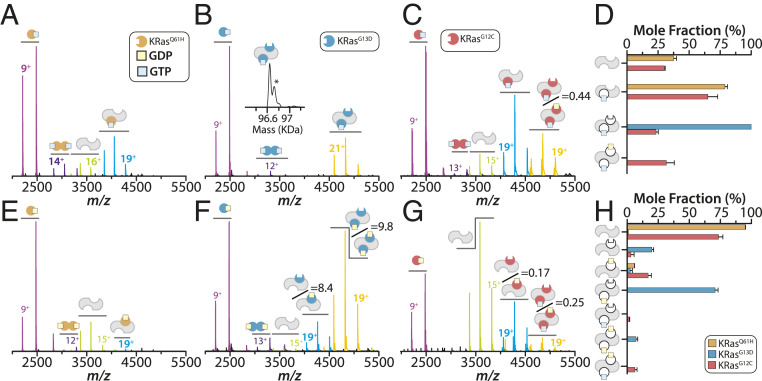
Fig. 2.
Distinct molecular assemblies of SOScat with oncogenic KRas mutants. (A–C) Native mass spectra of 2 µM SOScat mixed with three equivalents of (A) KRasQ61H–GTP, (B) KRasG13D–GTP, or (C) KRasG12C–GTP. Mass spectra are shown as described in Fig. 1. (D) Plot of the mole fraction of SOScat complexes formed with GTP-loaded proteins. (E–G) Mass spectra of 2 µM SOScat mixed with threefold molar excess of (E) KRasQ61H–GDP, (F) KRasG13D–GDP, or (G) KRasG12C–GDP. (H) Plot of the mole fraction of SOScat complexes formed with GDP-loaded proteins. Shown as described in Fig. 1.

