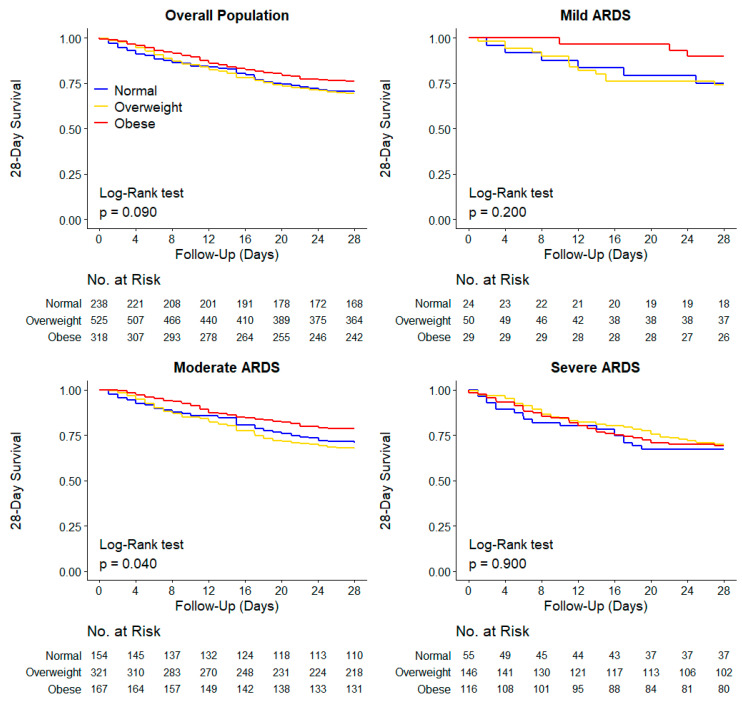
Figure 3.
Kaplan–Meier Curves for 28-day mortality in the overall population and groups according to ARDS severity. p values calculated from Log-rank test. Unadjusted and adjusted (shared-frailty) Cox proportional hazard models are shown in Tables S2–S4.

