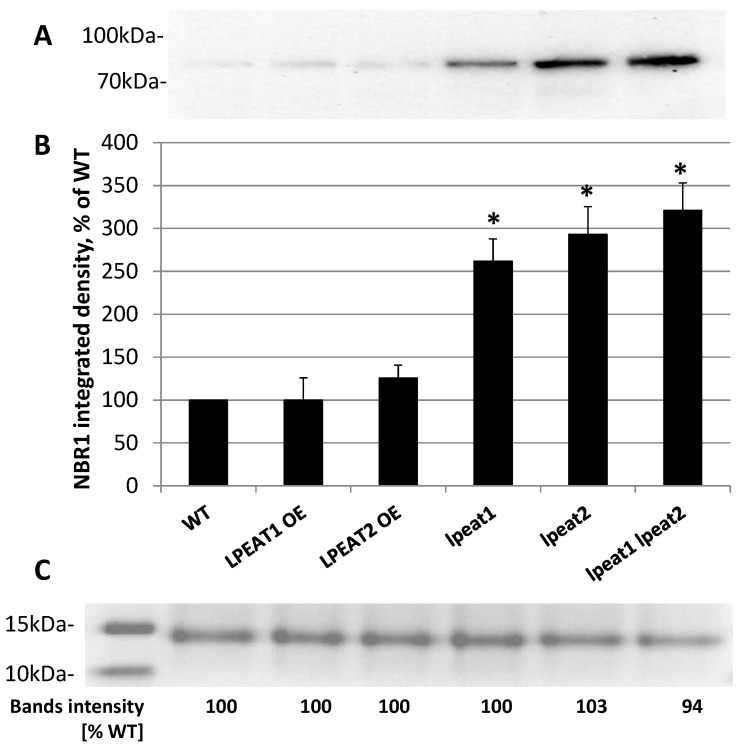
Figure 4.
(A) NBR1-selected western blot analysis of the total protein extracts from leaves (0 DAF) of wild-type Arabidopsis (Col-0) and LPEAT1 and LPEAT2 overexpressors, lpeat1 and lpeat2 single mutants and lpeat1 lpeat2 double mutant grown in soil under standard conditions. The blot was incubated with polyclonal antibodies against AtNBR1 protein. Equal amounts of protein (30 µg) were loaded and separated on NuPAGE 4–12% Bis-Tris-Gel. (B) NBR1 band average intensity (means ± SD) from 3 to 6 independent experiments as a percentage ofWT (wild type). Asterisk indicates significant difference compared with LPEAT1 OE (overexpressor) in “mean difference two sided test” at α = 0.05. (C) Fragment of selected gel with stained protein bands localized between 15 and 10 kDa and “Image Lab 6.01” analyses of the intensity of these bonds.

