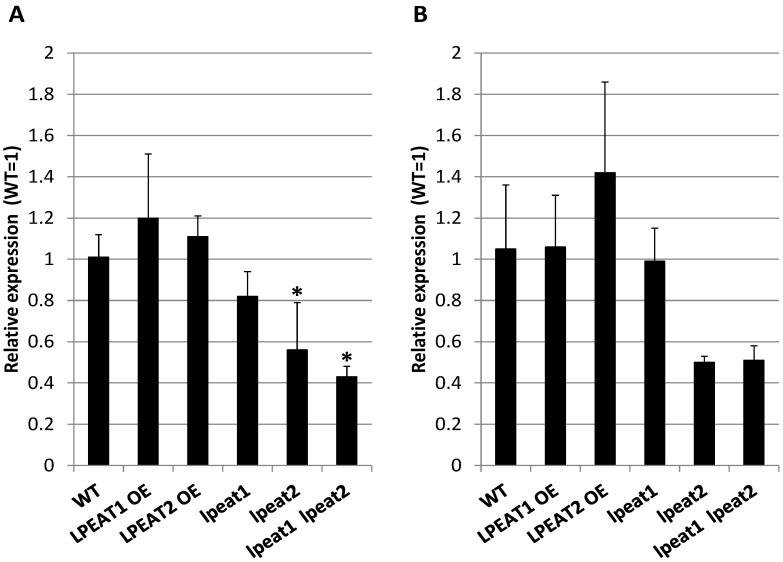
Figure 6.
ATG8a gene expression analysis between different Arabidopsis thaliana lines. ATG8a transcript level in LPEAT1 and LPEAT2 overexpressors as well as in lpeat1 mutant, lpeat2 mutant and lpeat1 lpeat2 double mutant is displayed as relative to this gene’s expression level in wild-type (WT) with the assigned value of 1. The EF1ALPHA (A) and ACT2 (B) gene expression was treated as reference in qRT-PCR. Means ± SD are presented (n = 3). Asterisk indicates significant difference compared with WT in “mean difference two sided test” at α = 0.05.

