Figure 4.
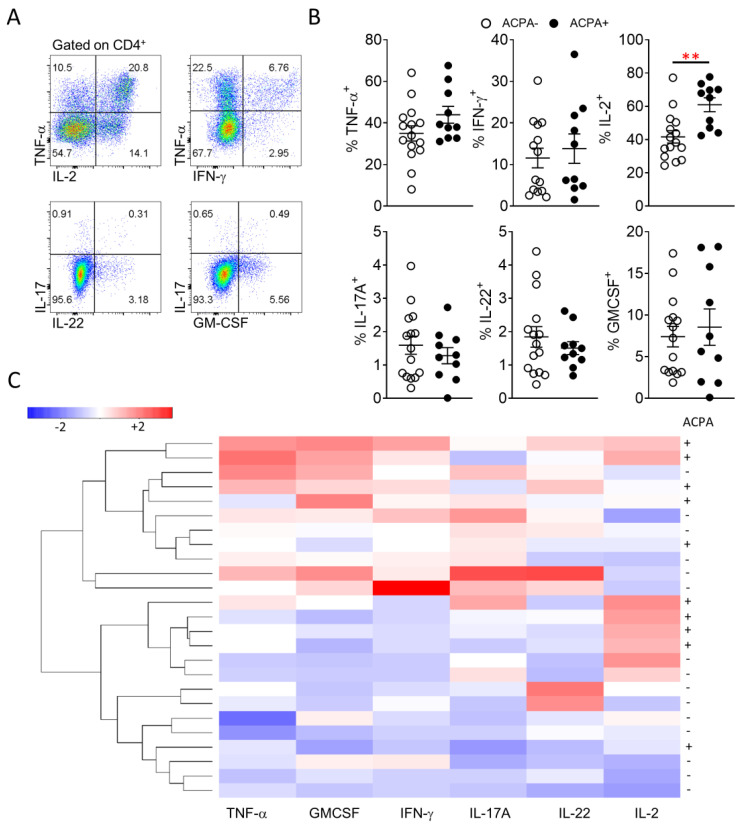
Similar peripheral blood CD4 T cell proinflammatory cytokine responses between ACPA− and ACPA+ RA patients. (A) Representative flow cytometric analysis for the identification of CD4 T cell proinflammatory cytokine responses. (B) Cumulative data for the CD4 T cell frequency of the indicated proinflammatory cytokines for ACPA− (n = 15) and ACPA+ (n = 10) RA patients. (C) Hierarchical clustering of ACPA− and ACPA+ RA patients based on scaled frequency of CD4 T cell cytokine production. Data are presented as mean ± SEM, symbols represent individual samples. Statistical analysis was performed by using two-tailed Mann-Whitney test, p < 0.05 were considered significant, (p < 0.01 **).

