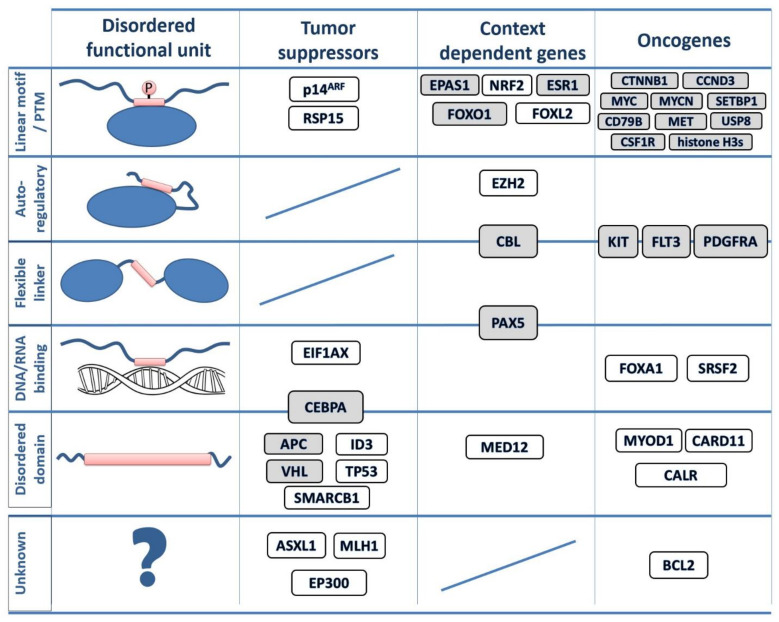
Figure 2.
IDP regions mutated in cancer. The classification of identified disordered cancer drivers. Protein names in gray indicate known switching mechanisms either via post-translational modifications (PTMs) or overlapping functions. In protein architecture schematics, blue ovals represent folded domains, blue lines represent disordered regions and red rectangles represent disordered driver modules. Boxes placed between two categories indicate dual functions. For detailed mutation profiles for each gene, see the online visualization links in Supplementary Table S2.

