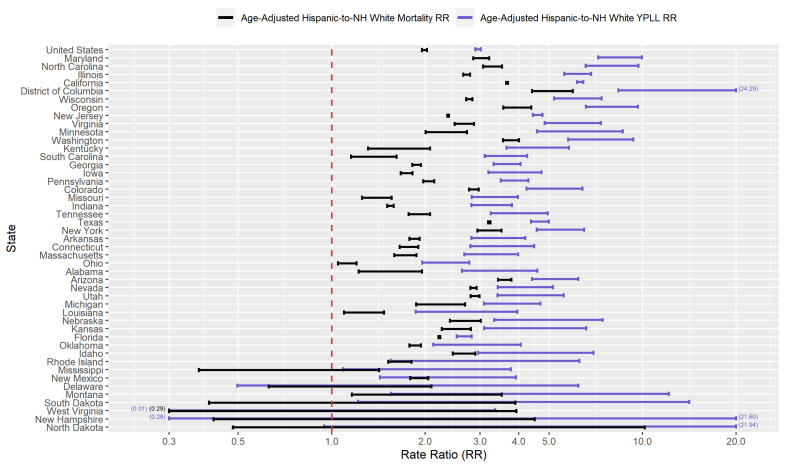
Figure 5.
Conservative 95% interval estimates of the age-adjusted Hispanic-to-NH White YPLL and mortality RR’s in the U.S. and in each examined state with respect to cumulative COVID-19 deaths according to data from the National Center for Health Statistics as of 30 December 2020. States are ordered from top to bottom in descending order of the signed difference between the lower limit of the YPLL RR interval and the upper limit of the mortality RR interval. Values are displayed on the base 10 logarithmic scale. Interval endpoints above 20.0 and below 0.30 are truncated, with the actual values numerically annotated.

