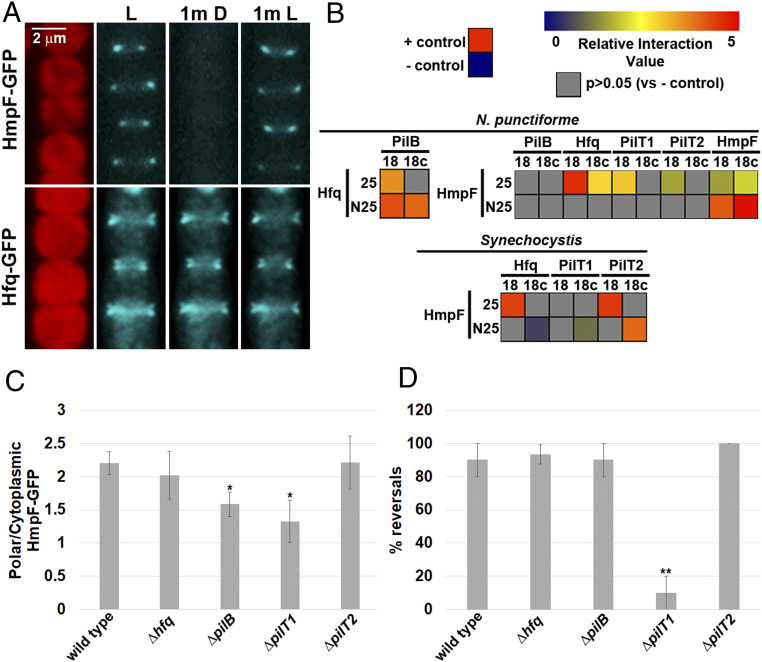
Fig. 1.
Interaction of HmpF with T4P components. (A) Localization of HmpF-GFP and Hfq-GFP in response to light. Depicted are fluorescence micrographs of cellular autofluorescence (red) and GFP fluorescence (cyan) at each interval of a light regiment with exposure to white light for 1 min (L), followed by darkness for 1 min (1m D), and subsequently white light for 1 min (1m L). (B) Heat maps depicting the results of BACTH analysis between various proteins of N. punctiforme and Synechocystis sp. strain PCC6803 fused to the C (25) and N (N25) terminus of the T25 fragment or C (18c) and N (18) terminus of the T18 fragment of B. pertussis adenylate cyclase. Data are derived from SI Appendix, Fig. S3. Relative interaction value = Log2(Experimental/– control). (C and D) Quantification of the fraction of HmpF-GFP localized to the poles (C) and HmpF-GFP polar reversals (D) in various T4P-gene deletion strains. Error bars = ±1 SD; *P value < 0.05 as determined by two-tailed Student’s t-test between the wild type and each deletion strain, **P value < 0.01, n = 3. C is derived from data depicted in SI Appendix, Fig. S6.

