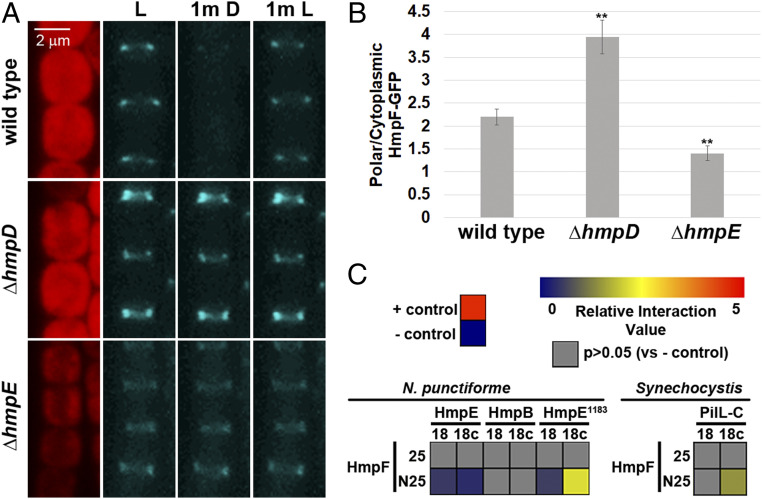
Fig. 2.
Regulation of HmpF by the Hmp system. (A) Localization of HmpF-GFP in response to light in strains harboring deletions in genes encoding Hmp system components. Depicted are fluorescence micrographs of cellular autofluorescence (red) and GFP fluorescence (cyan) at each interval of a light regiment with exposure to white light for 1 min (L), followed by darkness for 1 min (1m D), and subsequently by white light for 1 min (1m L). (B) Quantification of the fraction of HmpF-GFP localized to the poles in various Hmp-gene deletion strains. Error bars = ±1 SD; **P value < 0.01 as determined by two-tailed Student’s t-test between the wild type and each deletion strain; n = 3. B is derived from data depicted in SI Appendix, Fig. S6. (C) Heat maps depicting the results of BACTH analysis between various proteins of N. punctiforme and Synechocystis sp. strain PCC6803 fused to the C (25) and N (N25) terminus of the T25 fragment or C (18c) and N (18) terminus of the T18 fragment of B. pertussis adenylate cyclase. Data are derived from SI Appendix, Fig. S7. Relative interaction value = Log2(Experimental/– control).

