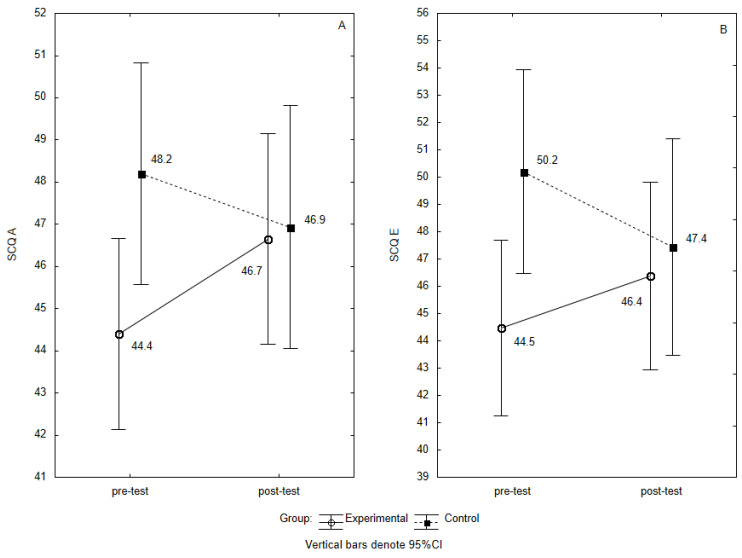
Figure 1.
(A,B) Distribution of the SCQ A and SCQ E scale scores for the Experimental and Control groups at pre-test and post-test. The mean value for 95% confidence interval. SCQ A and SCQ E scale scores for the Experimental and Control groups at pre-test and post-test. Note: CI—confidence intervals, SCQ A—mean scores of Social Competence Questionnaire, scale A—competences revealed in situations requiring assertiveness, SCQ E—mean scores of Social Competence Questionnaire, scale E—competences revealed in situations of social exposure.

