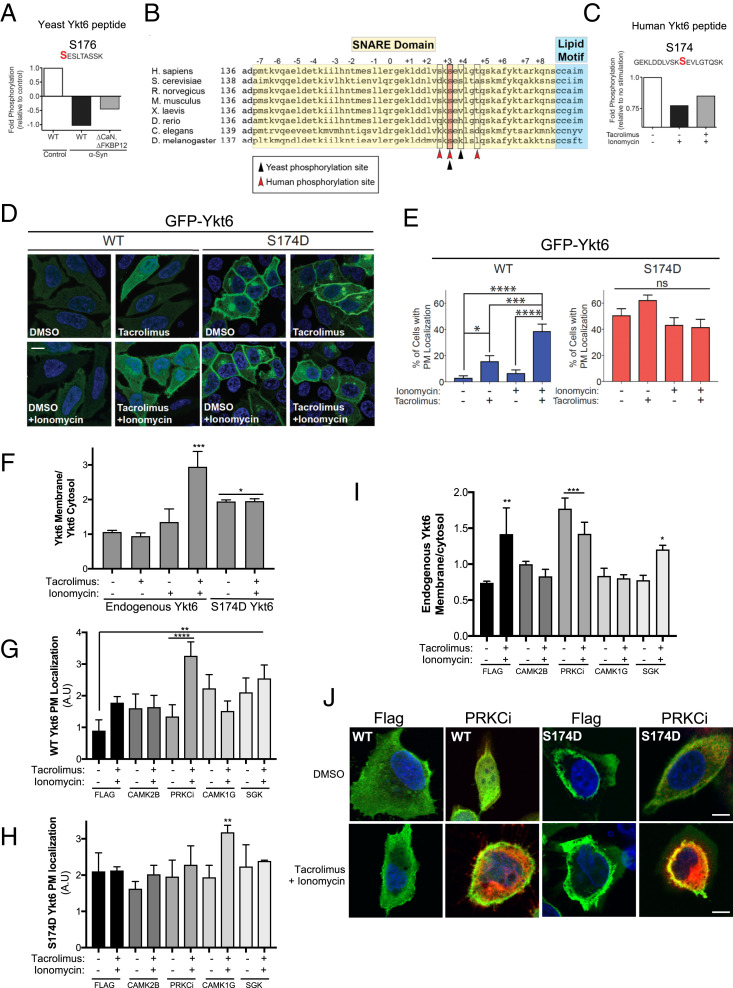
Fig. 1.
Evolutionarily conserved phosphorylation site within human Ykt6 SNARE domain (S174) is sensitive to calcineurin, evolutionarily conserved in yeast and in humans, and is a critical determinant for its intracellular localization. (A) Fold phosphorylation of the indicated peptide from endogenous yeast Ykt6 detected by shotgun phosphoproteomics after correction for protein abundance from control yeast cells and yeast cells with high levels of Ca2+ (driven by overexpression of α-syn) with either WT or knockout for calcineurin (∆CaN) and knockout for the modulator of calcineurin (∆FKBP12). The identified phosphorylation sites are highlighted in red. Data from triplicate samples were pulled together for illustrated analysis (28). Data from ref. 27. (B) Alignment of Ykt6 sequences across species. Highlighted in pink is the identified phosphorylation site conserved across evolution. Arrows depicted represent Ykt6 zero-layer arginine (white) and additional CaN-sensitive sites identified in phosphoproteomic screen (red is human, black is yeast). (C) Fold phosphorylation of the indicated human Ykt6 peptide from HEK293T cells as detected by iTRAQ MS. Prior to GFP-Ykt6 immunoprecipitation, cells were treated for 30 min with the Ca2+ ionophore ionomycin (1 μM) and cotreated with calcineurin-specific inhibitor tacrolimus (1 μM). (D) Representative IF images of transiently transfected HeLa cells with GFP-tagged wild-type (WT) or phosphomimetic mutant of Ykt6 (S174D). Cells were treated with ionomycin (1 μM) and/or tacrolimus (1 μM) for 30 min. Nuclei (blue) are stained with DAPI. (Scale bar, 10 μm.) (E) Quantification of cells with GFP plasma membrane localization as shown in A. n = 3; *P < 0.05, ***P < 0.001, ****P < 0.0001. One-way ANOVA, uncorrected Fisher’s least significance difference (LSD) test. (F) Quantification of Ykt6 on membrane fractions (Na+K+)/Ykt6 on cytosol fractions (tubulin) from Western blots after cell fractionation (see Dataset S1); n = 3. (G, H) Quantification of GFP-WT Ykt6 (G) or GFP-S174D Ykt6 (H) on PM fraction (see Materials and Methods for details) of HEK293T cotransfected with the indicated Flag-tagged kinases. (I) Quantification of endogenous Ykt6 membrane (Na+K+)/Ykt6 cytosol (tubulin) fraction from Western blots after cell fractionation of HEK293T cells transfected with the indicated Flag-tagged kinases; n = 3 (see SI Appendix, Fig. S5D). Stats for (F–I) **P < 0.05, ***P < 0.001, ****P < 0.0001. One-way ANOVA, uncorrected Fisher’s LSD test. All comparisons to dimethyl sulfoxide (dmso) control of Flag-transfected dmso. (J) 40× confocal images after IF for YKT6 (green) and FLAG-tagged candidate kinases (red) of HEK293T cells cotransfected with GFP-WT-Ykt6 and the indicated Flag-tagged kinase. Single Z-frame images were channel merged and background subtracted before processed for quantitative analysis. Individual representative cells were chosen from each condition to better present changes in intracellular localization of YKT6. (Scale bar, 10 μm.) n = 3; ∼600 cells total.

