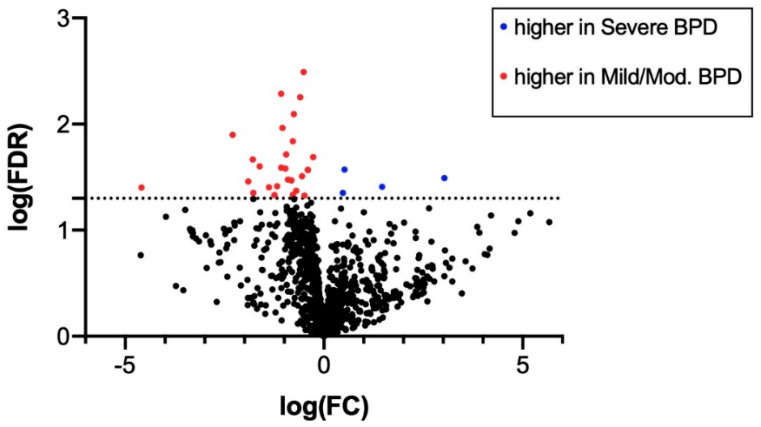
Figure 3.
Volcano plot of miRNAs expressed in tracheal aspirates from mild/moderate (n = 8) and severe (n = 17) BPD infants. Red dots indicate miRNAs upregulated in mild/moderate BPD samples. Blue dots indicate miRNAs with higher expression in severe BPD samples. FC: fold change; FDR: false discovery rate. Dotted line indicates log(FDR) = 1.3, corresponding to FDR = 0.05. Volcano plot was generated in GraphPad Prism software as described in Section 2.

