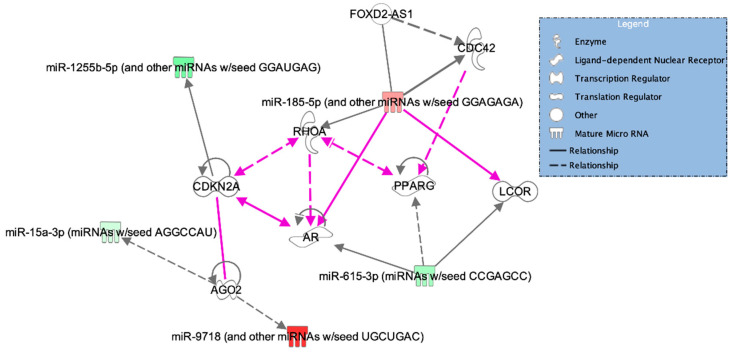
Figure 5.
Graphical representation for the top 4 networks associated with differentially expressed miRNAs in severe BPD samples. Grey lines represent individual pathways, and pink lines indicate interactions among pathways. Full and dotted lines indicate direct and indirect relationships between molecules, respectively. miRNAs with higher expression in the severe BPD group are shown in shades of red, according to upregulation intensity. Similarly, miRNAs with lower expression in severe BPD are shown in shades of green. AGO2: argonaut RISC (RNA-induced silencing complex) catalytic component 2; CDKN2A: cyclin-dependent kinase inhibitor 2A; AR: androgen receptor; LCOR: ligand-dependent nuclear receptor corepressor; CDC42: cell division cycle 42; FOXD2-AS1: FOXD2 (forkhead box D2) adjacent opposite strand RNA 1; PPARG: peroxisome proliferator-activated receptor gamma; RHOA: Ras homolog family member A.

