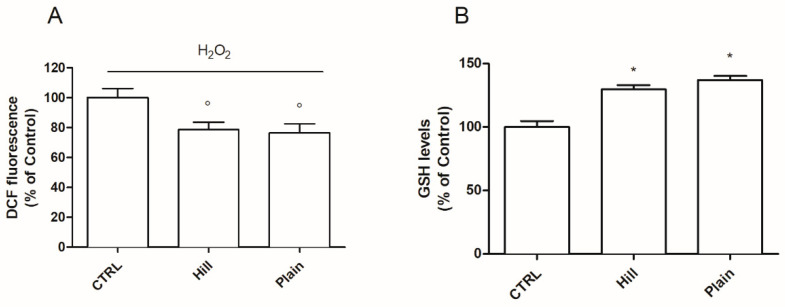
Figure 3.
Antioxidant capacity of EVOO extracts. Cells were treated with 10 µg/mL of hill and plain extracts for 24 h (A) The intracellular ROS levels were measured with the peroxide-sensitive probe DCFH-DA as reported in Materials and Methods. Data are expressed as percentage of H2O2. (B) The intracellular GSH levels were evaluated using the fluorescent probe monochloro bimane (MCB) as described in Materials and Methods. Data are expressed as percentage of control (CTRL). Each bar represents means ± SEM of at least three independent experiments. Data were analyzed by one-way ANOVA followed by Dunnett’s test or Bonferroni’s test. * p < 0.05 with respect to CTRL; ° p < 0.05 with respect to H2O2.

