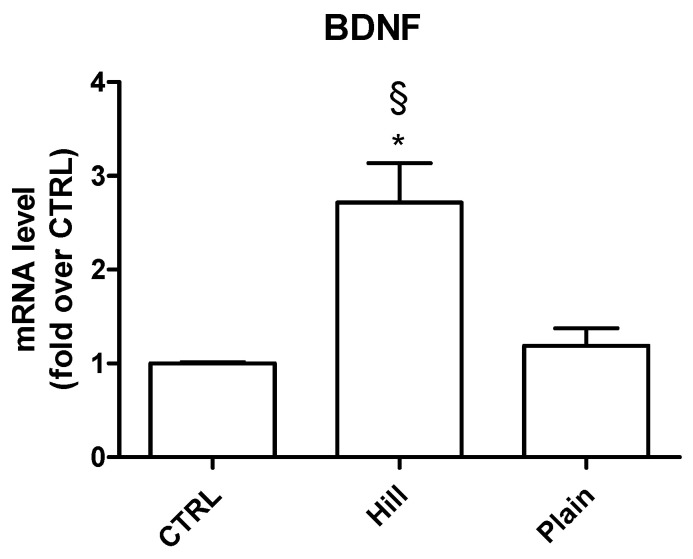
Figure 5.
Expression of BDNF in SH-SY5Y cells treated with the extracts. Cells were treated with hill and plain extracts (10 µg/mL) for 24 h. Real time-PCR was performed to detect BDNF mRNA levels. Data are expressed as relative abundance compared to untreated cells. Each bar represents mean ± SEM of three independent experiments. Data were analyzed with one-way ANOVA followed by the Bonferroni’s test. * p < 0.05 vs. CTRL; § p < 0.05 vs. plain.

