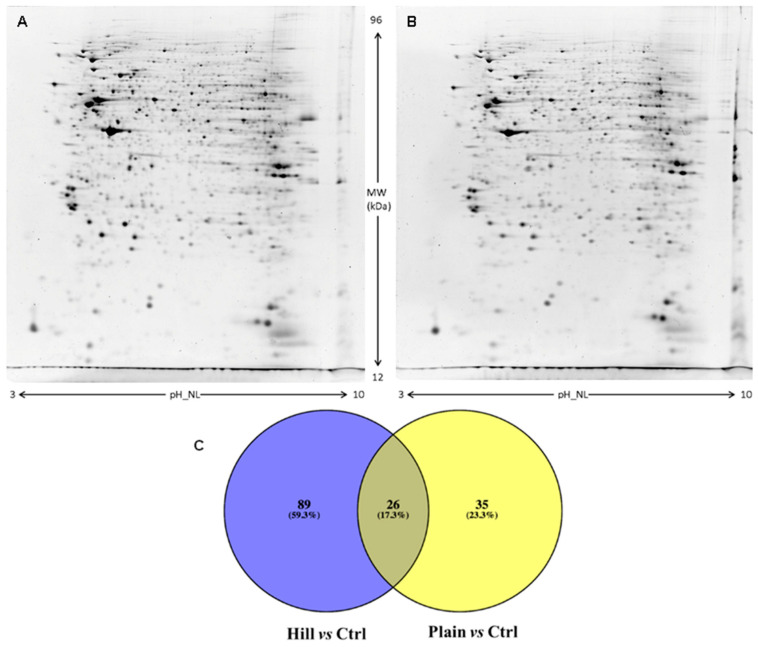
Figure 6.
2DE representative images of differentiated SH-SY5Y cell proteins treated with Hill (A) and Plain (B) extracts. Venn diagram (C) of different comparisons. (A,B) SH-SY5Y proteins were separated in a 3–10 nonlinear gradient. SDS-PAGE was performed using 12% acrylamide. Gels were stained with ruthenium. (C) Venn diagram highlighting the distribution of identified differentially expressed proteins in hill and plain extracts as compared to control. Both unique and overlapping proteins are reported as actual number and percentage (Venny 2.0.2).

