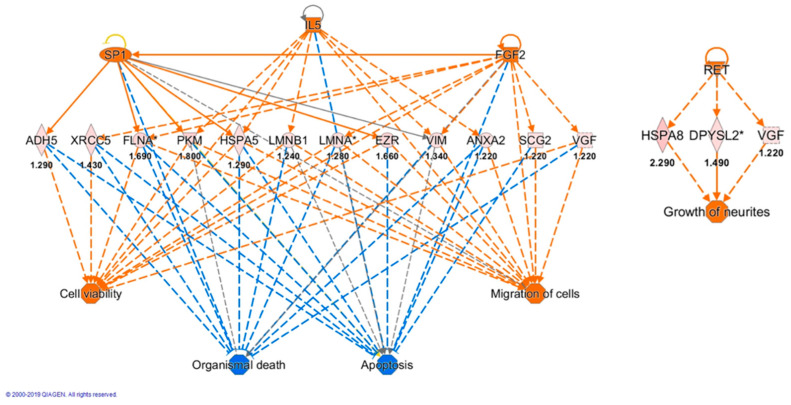
Figure 7.
Regulator network generated by IPA. Upstream regulators (SP1, IL5, FGF2 and RET) are displayed in the top tier while functions are displayed in the bottom tier. The data set proteins connecting regulators and lower functions are shown in the middle tier where the fold change value of each protein expression is reported below the gene name. The predicted regulators had a z-score (activation score) > 1.9 and a Fisher’s exact p-value < 0.05. Dashed lines are indirect effects and the protein shape indicates the protein class (defined by IPA). Orange and cyan connecting lines indicate activation and inhibition, respectively. Similarly, activated and inhibited downstream functions are orange and cyan. * More than one spot was identified for this protein.

