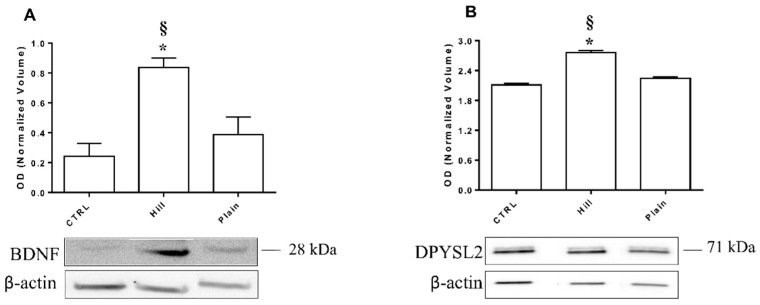
Figure 8.
WB analysis of BDNF (A) and DPYSL2 (B) expression in SH-SY5Y cells treated with and without EVOO extracts. Representative immunoblot images and histograms of band normalized OD are shown. Data are presented as mean ± SEM of three independent experiments. Data were analyzed with a one-way ANOVA followed by the Bonferroni’s test. * p < 0.05 vs. CTRL; § p < 0.05 vs. plain.

