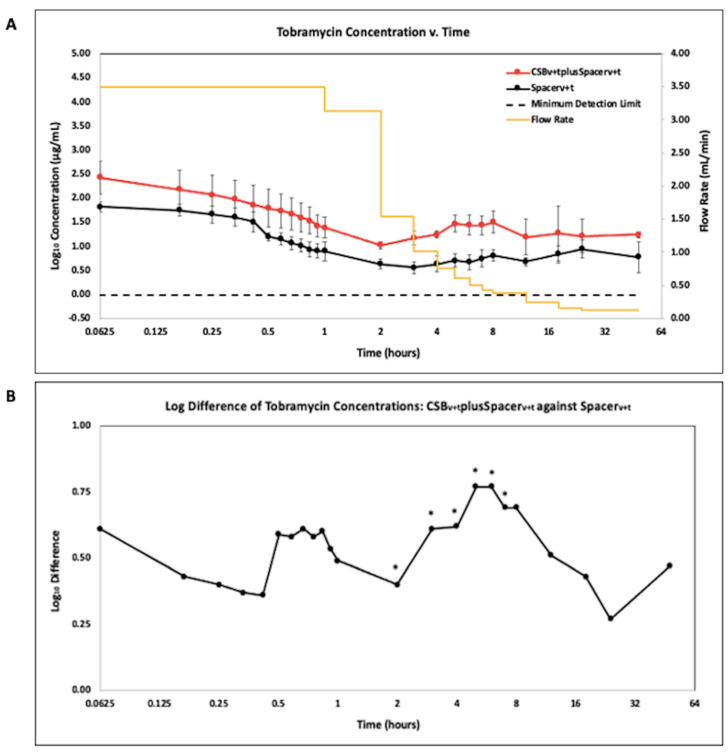
Figure 4.
(A). LCMS analysis of tobramycin in effluent samples from antibiotic loaded calcium sulfate beads with an antibiotic loaded PMMA spacer (CSBv+tplusSpacerv+t), and antibiotic loaded PMMA spacer (Spacerv+t). N = 6; geometric mean ± SE. The yellow curve is the influent saline flow rate. Time is shown on a log2 scale to show the changes more clearly in concentration at the early time points. (B). Log difference of tobramycin concentrations of the CSBv+tplusSpacerv+t method compared to the Spacerv+t method. (* p < 0.05).

