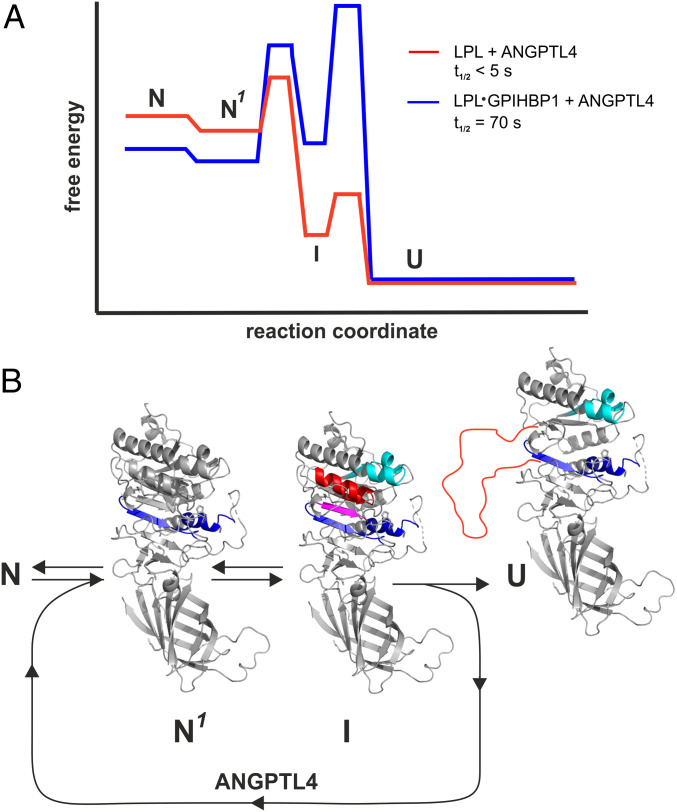
Fig. 8.
Energy landscape for ANGPTL4-catalyzed unfolding of LPL and LPL•GPIHBP1 complexes. (A) Proposed model for ANGPTL4-catalyzed LPL unfolding based on continuous and pulse-labeling HDX-MS studies performed at 15, 25, or 37 °C. Half-lives (t1/2) are calculated from pulse labeling of 10 µM LPL or 10 µM LPL•GPIHBP1 complexes incubated at 37 °C in 10 mM Hepes and 150 mM NaCl (pH 7.4) in the presence of 12 µM ANGPTL4. (B) Allostery in LPL induced by ANGPTL4 binding. N is the native structure of unbound LPL or LPL•GPIHBP1 complexes; N1 is the native structure of LPL or LPL•GPIHBP1 complexes in the setting of ANGPTL4 with increased dynamics of α5 and β6 (EX2 exchange kinetics) highlighted by blue. I is the intermediate conformation with increased dynamics in β3–α3 (cyan) and with reversible unfolding (EX1) of β5 (purple) and β4–α4 (red). U is inactivated LPL with irreversibly unfolded β4–α4–β5 (red line).

