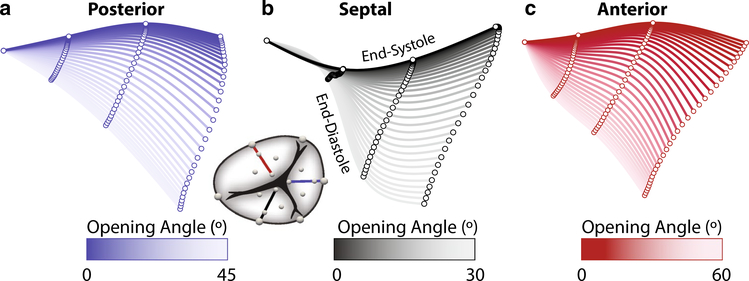
Fig. 3.
Kinematics of the radial centerline for the a posterior, b septal, c anterior leaflet during systole. We show the leaflet crystal coordinates after averaging between animals and after projecting them onto a least-squares plane. Each centerline is computed as a least-squares cubic spline and colored according to its angle relative to the center line at end-diastole. We calculated this angle using least-squares line fits to the crystals coordinates at each time point

