Figure 5.
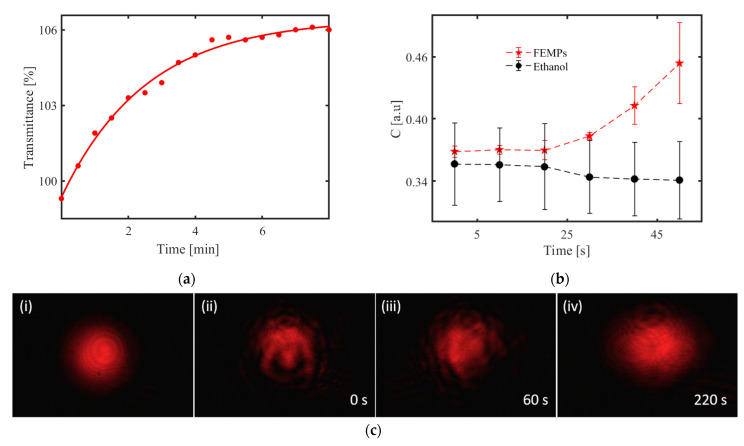
Sedimentation: (a) Measured transmittance (red dots) of the FEMP (MPs preserved in ethanol) samples with time at λ = 800 nm. The red curve is an exponential fit of the data. (b) Calculated speckle contrast from the measured speckle pattern using the diffractive optical element (DOE)-based sensor with a rough glass disk base and 700 μL volume of the samples. (c) Recorded patterns of the light beam transmitted through (i) pure ethanol and FEMPs after shaking at (ii) 0, (iii) 60, and (iv) 220 s with the charge-coupled device (CCD) camera.

