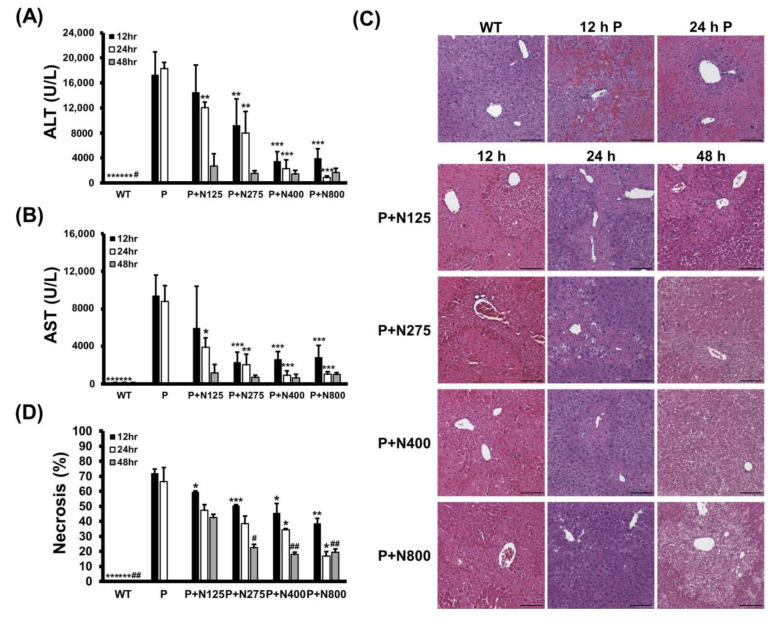
Figure 3.
Serum ALT (A) and AST (B) activities, histopathological images (C), and percentages of necrosis (D) in liver sections at 12, 24, and 48 h post-P1200 injection and with or without indicated doses of NAC therapies in BALB/c mice. WT: Mice treated with the same volume of phosphate-buffered saline (PBS); P: P1200 injection only; P+N: After P1200 injection, mice were treated with 125 mg/kg (P+N125), 275 mg/kg (P+N275), 400 mg/kg (P+N400), or 800 mg/kg (P+N800) NAC. Significant differences compared with the P group are indicated by * (p < 0.05), ** (p < 0.01), and *** (p < 0.001). Significant differences compared with the P+N125 group are indicated by # (p < 0.05) and ## (p < 0.01). Scale bars: 100 μm.

