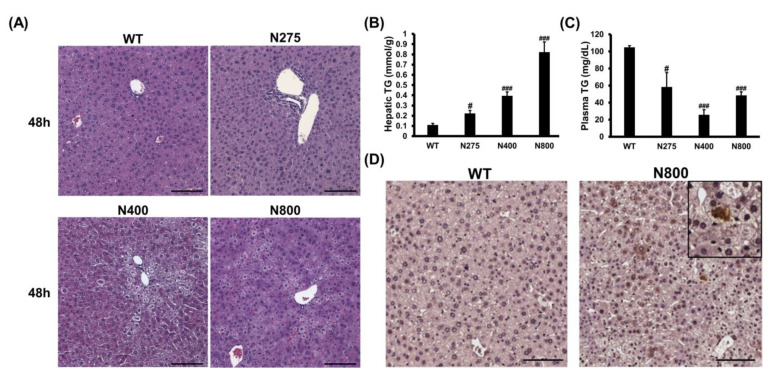
Figure 8.
Effects of different doses of NAC on histopathological images (A), hepatic and serum triglyceride (TG) levels (B,C), and IL-6 immunohistochemistry images of liver sections (D) at 48 h post-NAC injection in BALB/c mice. Significant differences compared with the WT group are indicated by # (p < 0.05) and ### (p < 0.001). Scale bars: 100 μm.

