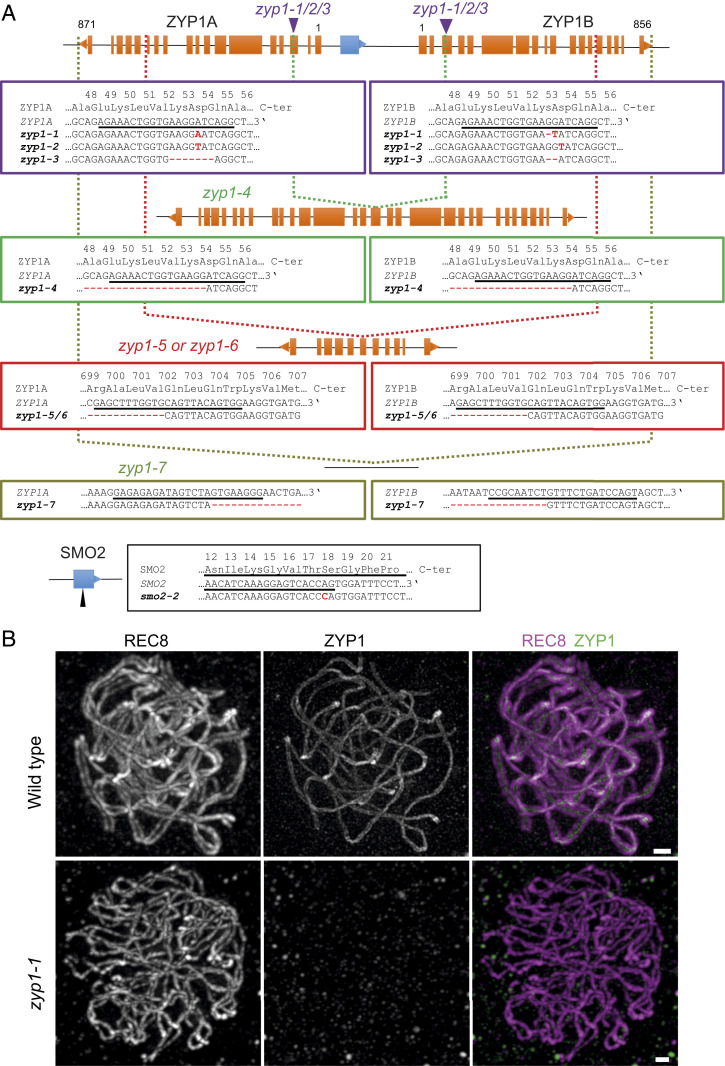
Fig. 2.
Identification of a series of zyp1a zyp1b double mutants. (A) A diagram of the ZYP1 locus, showing the exon organization of the ZYP1A, ZYP1B, and SMO2 genes. The orientations of the genes are indicated by a triangle at the end. The two purple arrows show the positions of the mutations in zyp1-1, zyp1-2, and zyp1-3. The green, red, and khaki vertical dotted lines show the position of the deletions in zyp1-4, zyp1-5/6, and zyp1-7, respectively. (B) ZYP1 is not detected in zyp1-1 mutant. A double immunolocalization was performed against REC8 (purple) and ZYP1 (green). The images at pachytene were acquired with STED microscopy. Maximum intensity projection: The individual plans are shown in Movies S3 and S4. (Scale bar, 0.5 µm.)

