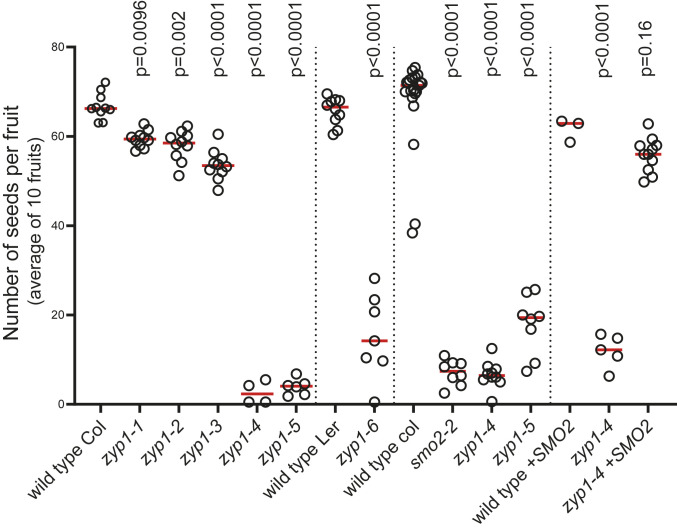
Fig. 3.
Analysis of fertility of zyp1 mutants. Each dot represents the fertility of an individual plant, measured as the number of seeds per fruit averaged on 10 fruits. The red bar shows the mean for a given genotype. The vertical lines separate independent experiments. In each experiment, all plants have been grown in parallel, and the wild-type controls are siblings of the mutants. The tests are one-way ANOVA followed by Fisher’s least significant difference (LSD) test compared with the respective wild-type control.

