Fig. 8.
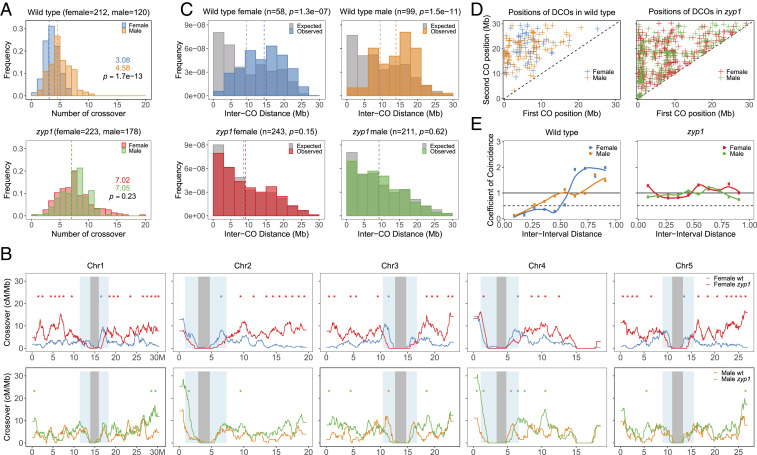
Analysis of CO distribution in male and female zyp1. COs were detected following whole-genome sequencing of male and female backcrosses. (A) Distribution of CO number per gamete. The number of analyzed samples is indicated in brackets. The mean CO number per gamete is given and indicated by a dashed line. The difference was assessed by a two-sided Mann–Whitney test. The CO distribution per chromosome and fitting to a Poisson distribution is shown in SI Appendix, Fig. S3. (B) The distribution of COs along the five chromosomes. The centromere and pericentromeric regions are indicated by gray and blue shading, respectively. Analysis is done with 1-Mb windows and 50-kb sliding steps. Intervals with significant difference between wild type and mutants are indicated by stars (P < 0.05, not overlapping 1-Mb windows, Chi2 test, without correction for multiple testing). (C) Distribution of inter-CO distances for chromosomes having exactly two COs. The gray bars represent the expected distribution of COs in absence of interference, as calculated by permuting the CO positions between gametes. The number of analyzed events and the Mann–Whitney U test comparing observed and expected distributions are indicated in brackets. (D) The positions of first and second COs for double-CO pairs, according to their physical distance. By construction, close CO pairs appear next to the diagonal, and distant COs appear in the top left corner. (E) The CoC Curves. Chromosomes were divided into 11 intervals, and the mean CoC was calculated for pairs of intervals separated by a certain distance (proportion of chromosome length).

