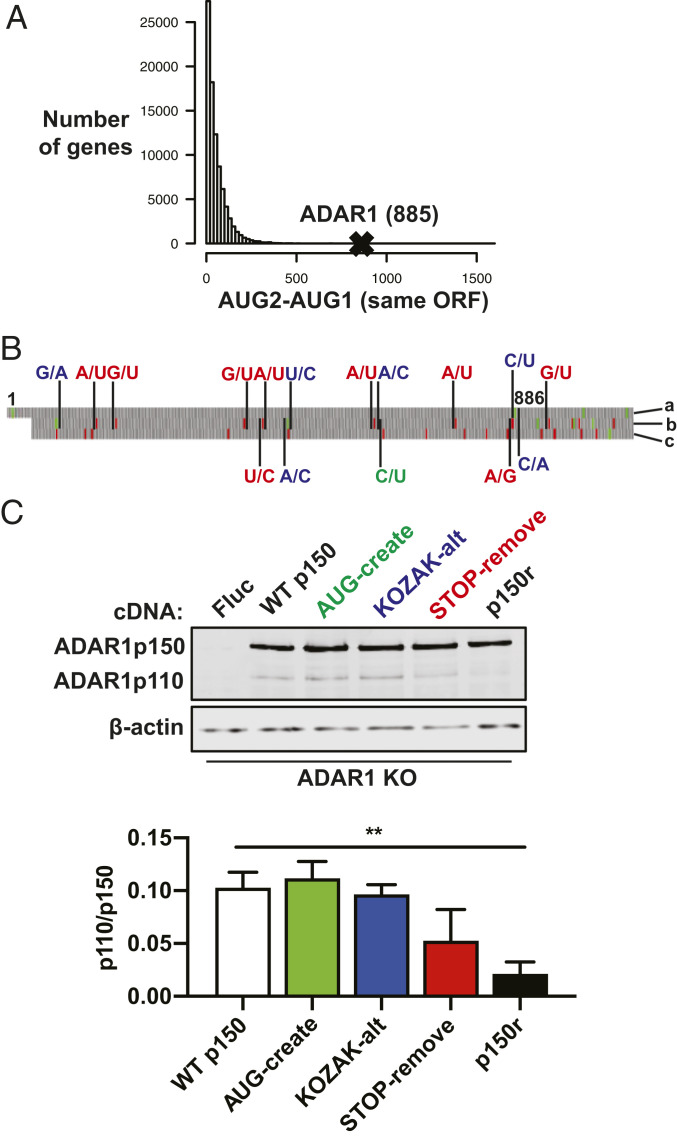
Fig. 3.
Synonymous mutations upstream of the p110 start codon reduce p110 expression from the p150 mRNA. (A) Human cDNA sequences compiled from GRCh38 were analyzed in RStudio. The histogram displays counts of genes with different nucleotide distances between the first two AUG codons (AUG2–AUG1) in the same open-reading frame (ORF). The AUG2–AUG1 value for the ADAR1 p150 ORF is 885. (B) The start of the ADAR1 p150 sequence is shown and nucleotides 1 (p150-AUG) and 886 (p110-AUG) are labeled. On the Right side, the letter labels refer to the reading frames, with “a” referring to the ADAR1 ORF and letters “b” and “c” referring to the two alternate ORFs. Synonymous mutations introduced into the p150 ORF are color coded as follows: green creates an additional start codon in the “b” ORF; blue weakens the Kozak consensus sequence surrounding the p110-AUG in the “a” ORF and strengthens the Kozak consensus sequence surrounding the AUG codons in the “b” ORF; red removes stop codons upstream of the p110-AUG and also removes one stop codon downstream of the p110-AUG, both for the “b” ORF. Green and red blocks correspond to AUG and stop codons, respectively. (C) Immunoblot shows ADAR1 isoforms in ADAR1 KO cells that were transduced with lentivirus to create cell clones that have stable expression of various constructs: firefly luciferase (Fluc), WT p150, green mutations from B (AUG-create), blue mutations from B (KOZAK-alt), red mutations from B (STOP-remove), and combined green/blue/red mutations (p150r). Relative band intensities quantified in ImageJ show levels of p110 relative to p150. Data points are shown as mean ± SEM and are gathered from three separate experiments. An unpaired t test comparing the WT p150 and p150r groups gives a P value of 0.0016.

