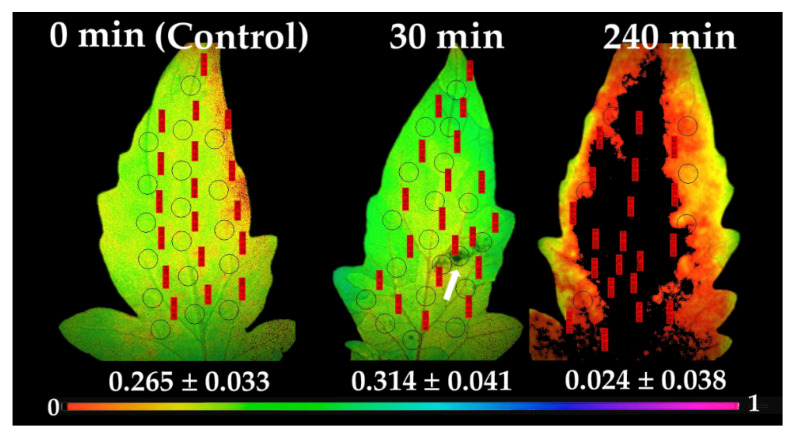
Figure 6.
Chlorophyll fluorescence images of ΦPSΙΙ, measured at 640 μmol photons m−2 s−1, before (0 min, control) and after 30 and 240 min of B. cinerea suspension application on tomato leaflets. The color code depicted at the bottom ranges from values 0.0 to 1.0. The circles in each image denote the areas of interest (AOI) that were selected in each leaflet and are complemented by red labels with their ΦPSΙΙ values, while whole leaflet value is presented. Arrowhead at ΦPSΙΙ image after 30 min of B. cinerea suspension application points at the visible area of the aquatic spore suspensions.

