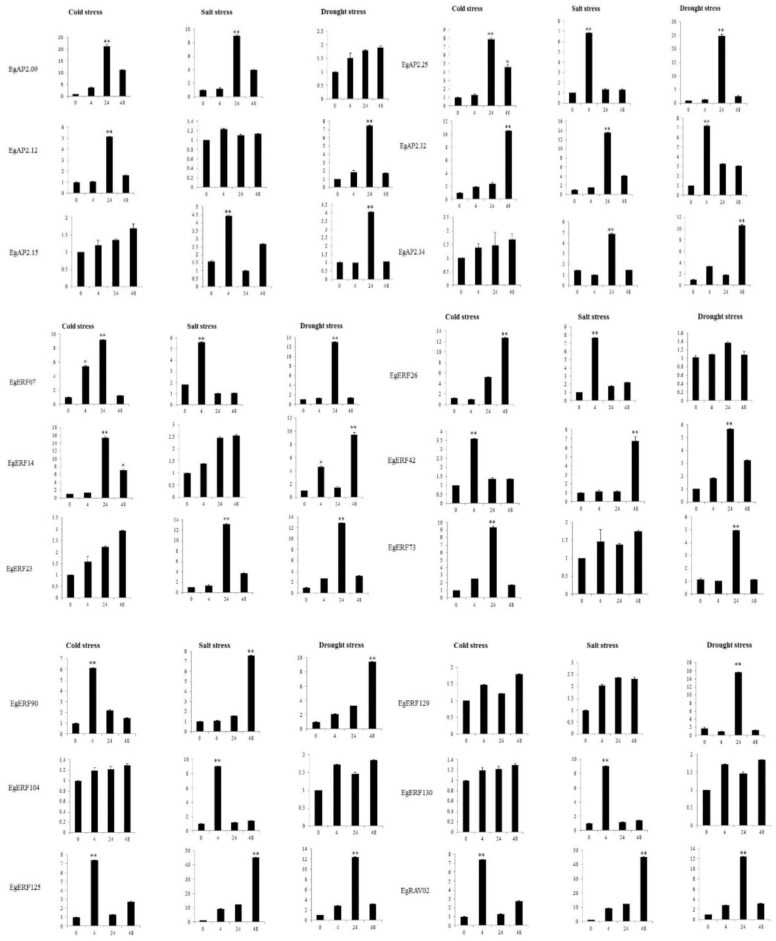
Figure 8.
Real-time PCR analysis of 18 AP2/ERF transcription factors in response to cold, salt, and drought stress (0, 4, 24 & 48 h) conditions. X-axis represents the hours of stress exposure. Y-axis represents the relative expression of a transcription factor. Data represent the mean ± SE of three replicates. Asterisks represent significant difference at p ≤ 0.05 (*) and p ≤ 0.01 (**).

