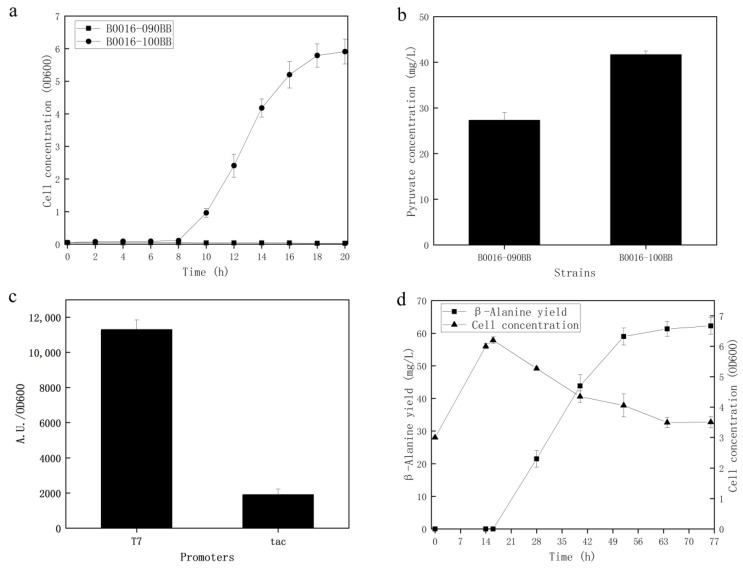
Figure 3.
The profile of growth and production capability of the cell factory constructed with the guide of ALE. The growth curve (a) and the accumulation of pyruvate (b) were compared among B0016-090BB and B0016-100BB in M9 and M9Y media, respectively. The production capacity of B0016-200BB harboring the plasmid pET24a-panD-AspDH (d). Before bioconversion, gfp was applied as a reporter gene to compare the expression strength of tac and the T7 promoter (c) to optimize the expression cassette.

