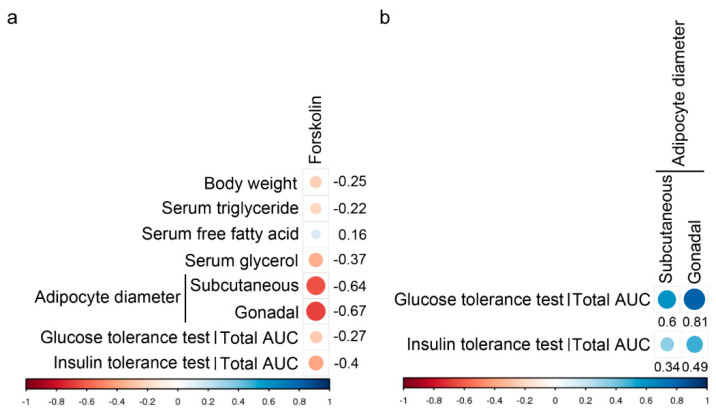
Figure 5.
Pearson’s correlation analysis. (a) The correlation coefficient between the concentration of forskolin with body weight, serum lipid parameters (triglyceride, free fatty acid and glycerol), adipocyte size (subcutaneous and gonadal fat), or total AUC (glucose tolerance test and insulin tolerance test) in high-fat diet-induced mice. (b) The correlation coefficient between adipocyte size (subcutaneous and gonadal fat) and total AUC (glucose tolerance test and insulin tolerance test) in high-fat diet-induced mice. Positive correlations are displayed in blue and negative correlations are in red color. Circle sizes are proportional to the correlation coefficients.

