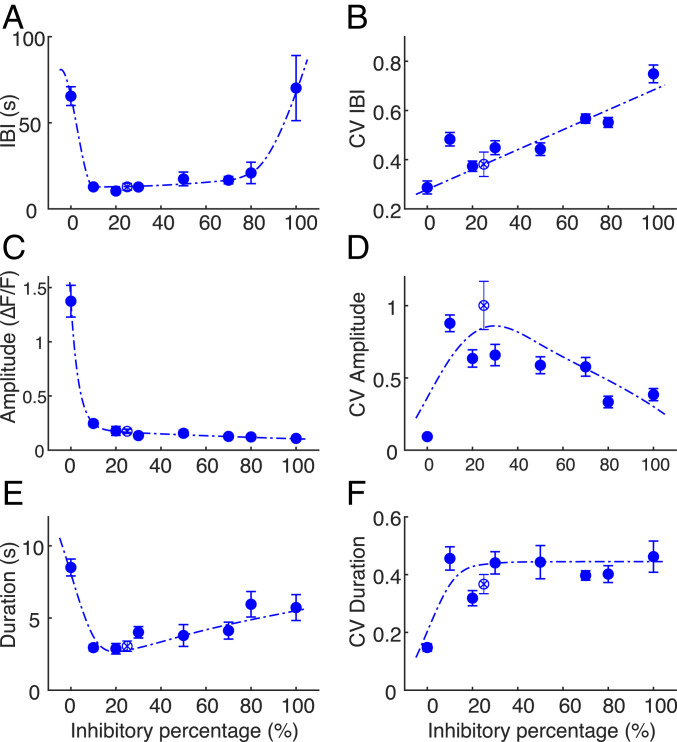
Fig. 3.
Bursting dynamics as a function of E/I composition. (A) IBIs follow a U-shaped trend as function of inhibitory percentage, with higher values at the extreme cases (0 and 100%) but are relatively constant in midrange (10 to 80%). (B) The CV of IBIs, a measure of the variability, grows linearly along the full range of inhibitory percentages. (C) Burst amplitudes drop from 0 to 10% inhibition and continue to decay till 100% inhibition. (D) The CV of burst amplitude is minimal for 0% inhibition (0.09 ± 0.02). Increasing the inhibitory percentage to 10% leads to a sharp increase of amplitude variance, which then gradually decays at higher inhibition fractions. (E) Burst duration is maximal for 0% inhibition (8.5 ± 0.6 s) and abruptly decreases at 10% inhibition. The duration gradually increases with higher inhibitory percentage. (F) Durations of 0% inhibitory cultures exhibit a relatively low CV of 0.15 ± 0.01. Other fractions in the range of 10 to 100% inhibition display a relatively constant value around 0.45. In all panels, the dashed lines are meant only as a guide to the eye, the error bars indicate the SEM, and control (no FACS) is displayed as an empty circle with × inside.

