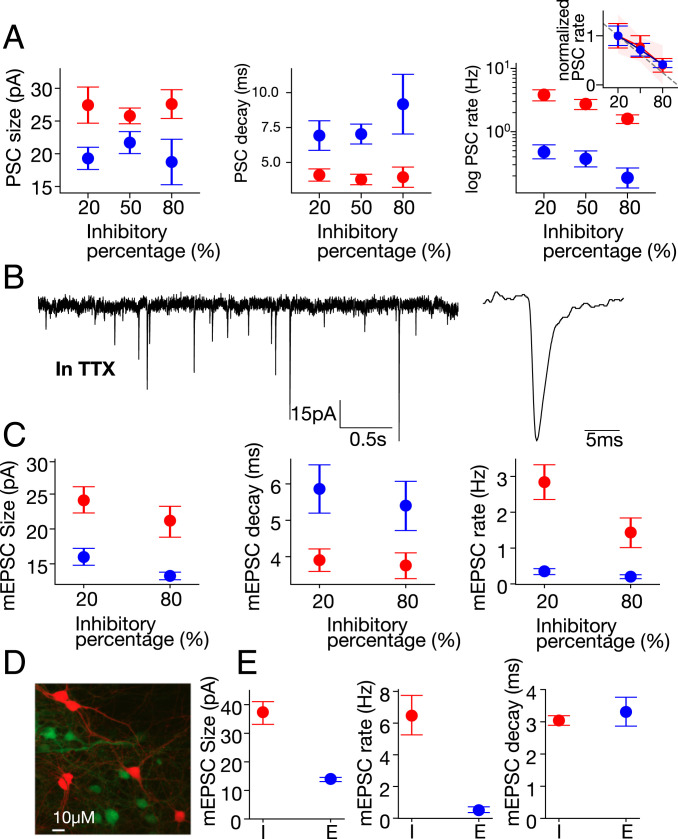
Fig. 4.
Patch-clamp measurement. Single-cell changes (mean ± SEM) in response to varying the network inhibitory percentages is presented for inhibitory (red) and excitatory (blue) neurons. (A) While the size (Left) and decay time (Middle) of spontaneous PSCs do not change with inhibition, a significant decrease occurs in the PSC rate (Right, logarithmic scale). (Inset) Normalizing PSC rates by the value at 20% inhibition highlights the substantial (and similar) decrease for both excitatory and inhibitory cells. Moreover, the linear fit to the decrease (dashed line, 95% CI-red area) shows the rate to be directly proportional to the number of excitatory cells. (B) Sample mEPSCs (Left), recorded in 0.5 μM TTX and 10 μM bicuculline, from a red (inhibitory) cell in a 20% inhibitory culture (zoom-in, Right). (C) mEPSC size (Left) and decay time (Middle) also do not change with inhibition. However, the rate does change significantly, showing lower values at higher inhibition percentage (Right). (D) Image of a field containing red (CRE-GAD-tdTomato) and green (CRE-OFF-YFP) neurons. (E) Within the same culture, mEPSC size (Left) and rate (Middle) are significantly higher in inhibitory (I) versus excitatory (E) neurons, while the decay time (Right) is similar. See SI Appendix, SI Methods for the statistical analysis.

