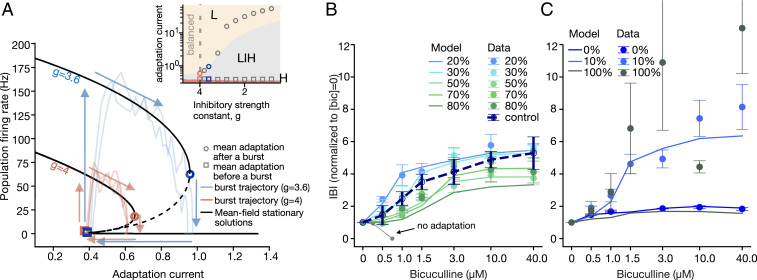
Fig. 6.
Blocking of inhibitory synapses reveals the bursting mechanisms. (A) Trajectories in a phase space defined by the population firing rate and spike-frequency adaptation for inhibitory strengths g = 3.6 and g = 4.0 (solid black lines, stable solutions; dashed lines, unstable solutions). At g = 4, the network is in the balance condition; at g = 3.6, it is in the excitation-dominated condition. The pale lines show examples of individual burst trajectories (pink, balanced network; blue, excitation dominated). Larger values of the adaptation at the burst end lead to longer IBIs. (Inset) The size of the bistable region increases with decreasing inhibitory strength. The squares and circles indicate the average adaptation at the beginning and end of simulated bursts. Decreasing the inhibitory strength leads to higher burst amplitudes and longer IBIs. (B) In networks with 20 to 80% of inhibitory neurons, the increase in bicuculline concentration (logarithmic scale) results in longer IBIs—that is, within experimental error, similar to the control cultures. The model (lines) reproduces the experimental results (dots). In contrast, no adaptation model (gray) decreases the IBIs and transitions to a nonbursting dynamic. The IBIs are normalized by the mean at 0 μM bicuculline. (C) Bicuculline application to networks with extreme inhibitory percentages and the corresponding responses of the model.

