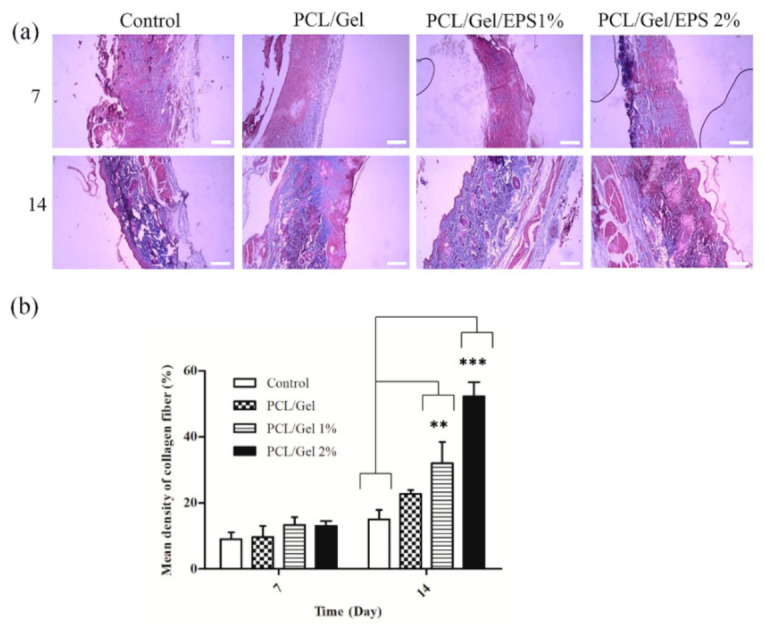
Figure 8.

(a) Microscopic images of Trichrome Masson-stained tissues after 7- and 14-days post-surgery. (b) Statistical analysis according to the integrated optical density (IOD) value and mean density measured by Image-J software. Data are presented as the means ± standard deviation for at least three independent experiments. ** p < 0.01 vs. the control group, *** p < 0.01 vs. the control group.
