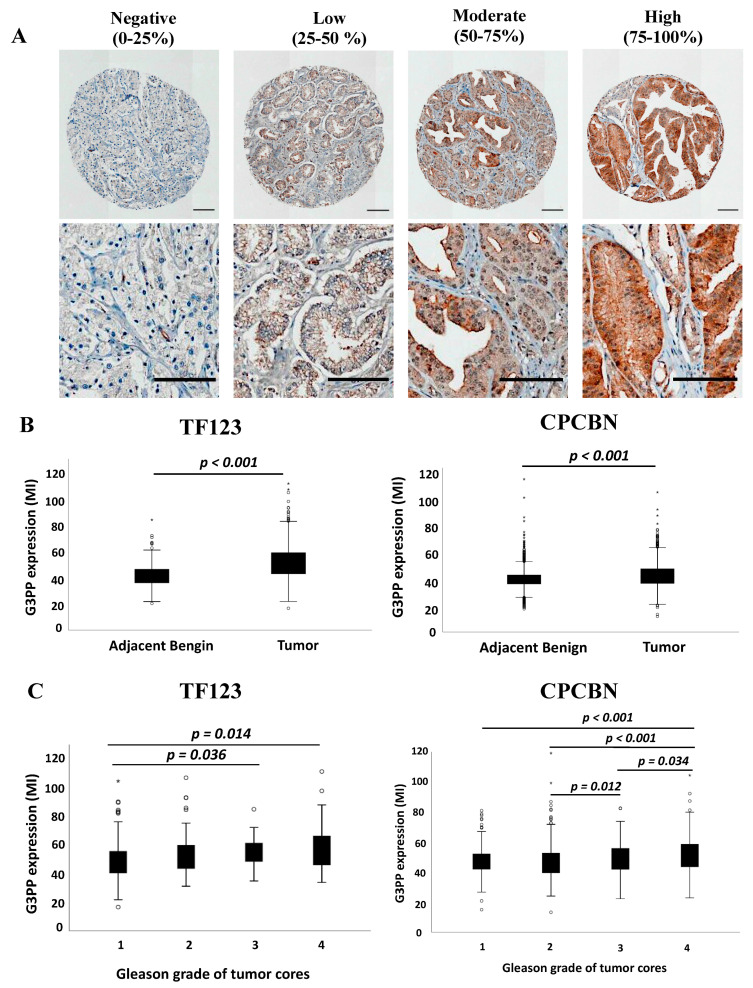
Figure 1.
Epithelial expression of glycerol 3-phosphate phosphatase (G3PP) in prostate cancer tissues. (A) Representative images of G3PP immunostaining on tissue micro array (TMA) cores of prostate cancer. Images represent expression of G3PP protein at less than the 25th percentile, between the 25th and 50th, between 50th and 75th, and more than 75th percentile. Scale bars, 200 μm (top) and 50 μm (bottom). (B) Box-plot representation of epithelial expression of G3PP in prostate cancer tissues versus benign adjacent tissues of the TF123 and CPCBN tissue micro arrays (TMAs) (p-value, Mann–Whitney U test) and (C) box-plot representation of epithelial expression of G3PP in prostate cancer tissues in the different Gleason score categories (1, 2, 3, or 4) (p-value, Kruskal–Wallis test).

