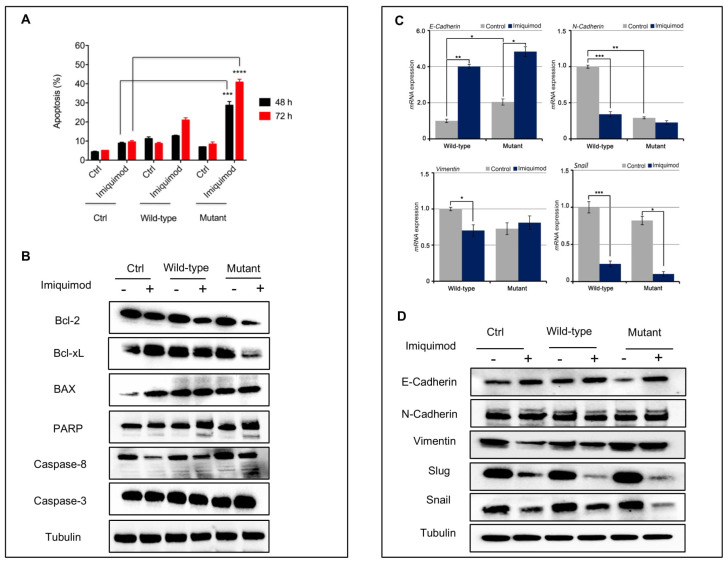
Figure 4.
(A) Bar chart showing the percentage of apoptotic cells on MeWo cell lines following treatment with imiquimod (1 µM) for 48 and 72 h; (B) Apoptotic markers after treatment with IMQ (1 µM) in MeWo cells were evaluated by Western blot analysis (bar graphs in Supplementary Figure S2); (C,D) EMT markers before and after treatment with IMQ (1 µM) in MeWo cells were evaluated by qRT-PCR and Western blot analysis (bar graphs in Supplementary Figure S3). Control: MeWo parental cell line; Wild-type: MeWo cell line transfected with SMO wild-type vector; MeWo cell lines: transfected with SMO mutant vector. * p < 0.1, ** p < 0.01, *** p < 0.001.

