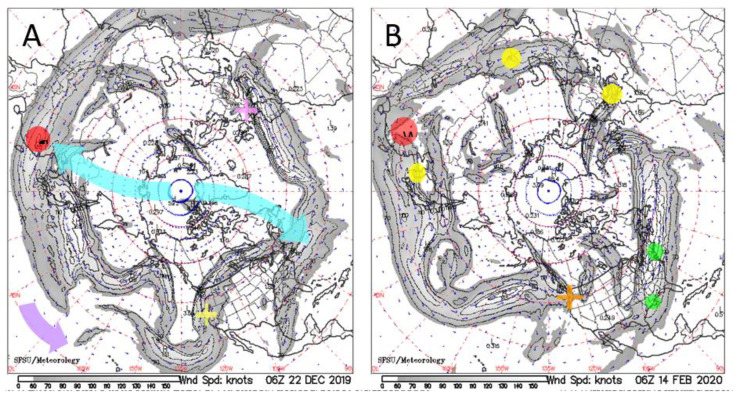
Figure 4.
COVID-19 onsets [46,74] compared to NH Jet stream behavior. Maps from California Regional weather server [78]: (A) 22 December 2019. Red dot = Wuhan, China. Purple arrow = W to E flow of Jet stream meanders and winds. Blue arrows = sketch of surface winds in the Polar cell, which flow South and slightly West according to the Coriolis effect, rise under the Jet stream, return North near the top of the troposphere, and sink at the Pole. Flow towards France is consistent with discovery of a single case in December (pink cross), as rainout was into the Atlantic and likewise for the Pacific (bottom arrow), so isolated cases appeared in February in the US (yellow cross); (B) 14 February 2020. Yellow dots mark Italy, Iran, and Korea, which gained substantial cases in February. Green ovals mark New York City (under strong winds) and New Orleans with climbs in early March. Orange cross marks 37 deaths in February in a Seattle, WA nursing home.

