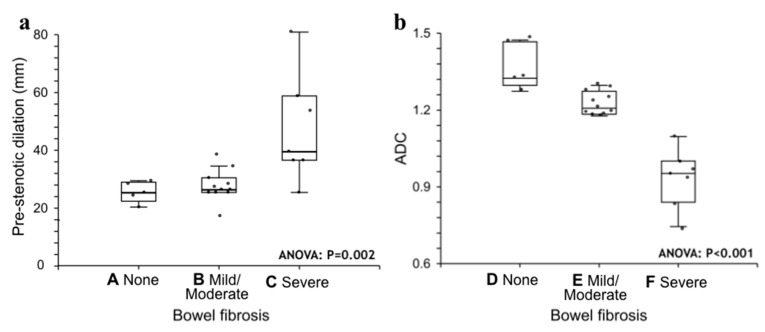
Figure 4.
(a,b). Statistical analysis. Pre-stenotic upstream bowel dilatation (panel a) and ADC (panel b) sorted by fibrosis score. Medians are given with the interquartile range (IQR). ANOVA tests were performed. Bonferroni multiple comparison test: A ≠ C; B ≠ C; D ≠ E ≠ F. ADC = apparent diffusion coefficient.

