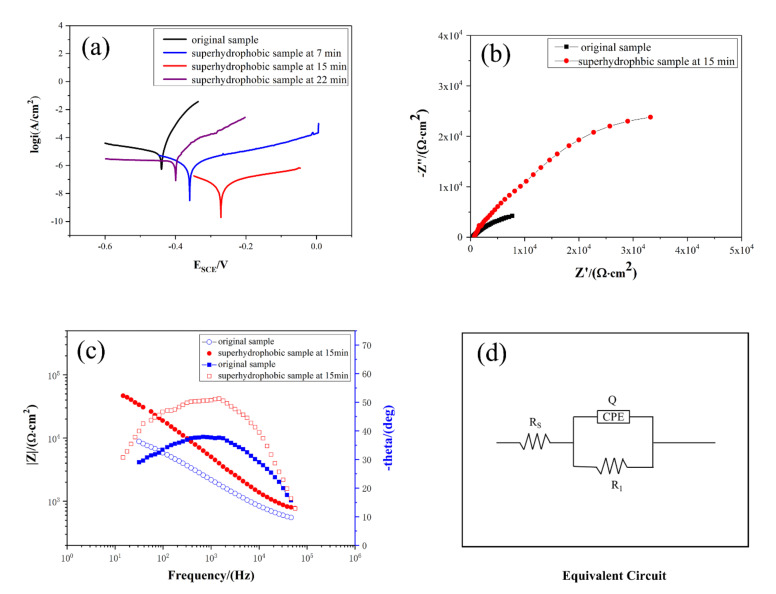
Figure 4.
(a) Polarisation curves of samples in different corrosion times in 3.5 w.t.% NaCl solution; (b) Nyquist plots of the original sample and the superhydrophobic sample in a 3.5 wt.% NaCl solution; (c) bode plots of the impedance spectrum of the original sample and the superhydrophobic sample in a 3.5 wt.% NaCl solution; (d) equivalent circuit diagram.

